HOT TOPICS LIST
- MACD
- Fibonacci
- RSI
- Gann
- ADXR
- Stochastics
- Volume
- Triangles
- Futures
- Cycles
- Volatility
- ZIGZAG
- MESA
- Retracement
- Aroon
INDICATORS LIST
LIST OF TOPICS
PRINT THIS ARTICLE
by Gary Grosschadl
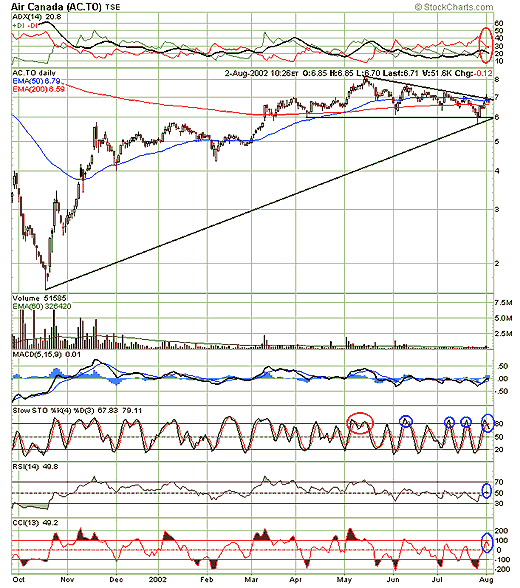
Since topping out at the $8 area, Canada's dominant airline is now in a potentially bearish pattern - a descending triangle.
Position: N/A
Gary Grosschadl
Independent Canadian equities trader and technical analyst based in Peterborough
Ontario, Canada.
PRINT THIS ARTICLE
CHART ANALYSIS
When is it Safe to Short a Stock? Air Canada May Be Losing Altitude
08/08/02 08:09:23 AMby Gary Grosschadl
Since topping out at the $8 area, Canada's dominant airline is now in a potentially bearish pattern - a descending triangle.
Position: N/A
| Aggressive short-term traders could short this failure at the trendline top shown belown on Air Canada's daily chart. Also supporting this short are the overbought and downturning stochastics, and the directional movement's bearish action. Failure for the DI's (the red and green lines on ADX indicator) to do a bullish cross has bearish consequences. Note how the past three stochastic turns from above 80 (overbought zone) resulted in tradeable downlegs in the short term. The danger would be a stochastic reversal from higher levels as happened last May. For this aggressive short-term short to be worthwhile, the stock would have to crash through the 200-day EMA again, possibly resulting in a test of support at $6. At any rate this short-term play should be handled as before - cover the short at the low stochastic turn from 20 or below (oversold level). |

|
| Graphic provided by: stockcharts.com. |
| |
| The safer and more prudent longer-term play would be to wait for the breakdown of this descending triangle (if this indeed happens) which could occur as the $6 support is breached. Ideally, volume should surge higher at this breakdown point. By measurement, the decline could be as much as 2 points bringing the stock down to $4 -- down to longer-term support. However this may be overly ambitious as there is a likely balk around the $5 congestion zone. Wherever the stock decides to turn back up, there should be various signs for the technical trader to take his or her cues. |
Independent Canadian equities trader and technical analyst based in Peterborough
Ontario, Canada.
| Website: | www.whatsonsale.ca/financial.html |
| E-mail address: | gwg7@sympatico.ca |
Click here for more information about our publications!
PRINT THIS ARTICLE

Request Information From Our Sponsors
- StockCharts.com, Inc.
- Candle Patterns
- Candlestick Charting Explained
- Intermarket Technical Analysis
- John Murphy on Chart Analysis
- John Murphy's Chart Pattern Recognition
- John Murphy's Market Message
- MurphyExplainsMarketAnalysis-Intermarket Analysis
- MurphyExplainsMarketAnalysis-Visual Analysis
- StockCharts.com
- Technical Analysis of the Financial Markets
- The Visual Investor
- VectorVest, Inc.
- Executive Premier Workshop
- One-Day Options Course
- OptionsPro
- Retirement Income Workshop
- Sure-Fire Trading Systems (VectorVest, Inc.)
- Trading as a Business Workshop
- VectorVest 7 EOD
- VectorVest 7 RealTime/IntraDay
- VectorVest AutoTester
- VectorVest Educational Services
- VectorVest OnLine
- VectorVest Options Analyzer
- VectorVest ProGraphics v6.0
- VectorVest ProTrader 7
- VectorVest RealTime Derby Tool
- VectorVest Simulator
- VectorVest Variator
- VectorVest Watchdog
