HOT TOPICS LIST
- MACD
- Fibonacci
- RSI
- Gann
- ADXR
- Stochastics
- Volume
- Triangles
- Futures
- Cycles
- Volatility
- ZIGZAG
- MESA
- Retracement
- Aroon
INDICATORS LIST
LIST OF TOPICS
PRINT THIS ARTICLE
by Koos van der Merwe
We all know the saying, "Buy on rumor and sell on fact." Is this happening to Research In Motion (RIM)? RIM announced its new BlackBerry phones on January 30. It also changed its company name to BlackBerry.
Position: Sell
Koos van der Merwe
Has been a technical analyst since 1969, and has worked as a futures and options trader with First Financial Futures in Johannesburg, South Africa.
PRINT THIS ARTICLE
TECHNICAL INDICATORS
Research In Motion Now BlackBerry
02/04/13 08:50:43 AMby Koos van der Merwe
We all know the saying, "Buy on rumor and sell on fact." Is this happening to Research In Motion (RIM)? RIM announced its new BlackBerry phones on January 30. It also changed its company name to BlackBerry.
Position: Sell
| As we all know, the BlackBerry cell phone was so popular that it earned the nickname "Crackberry," and then along came Steve Jobs with the iPhone. We all know what happened to the BlackBerry after that, and to the company's share price. Honestly, I thought the company was history; I thought that it would be taken over -- bought out like Palm, but it looks like I could be wrong. From a 40% share of the market two years ago, today it only has 2% of the market. |

|
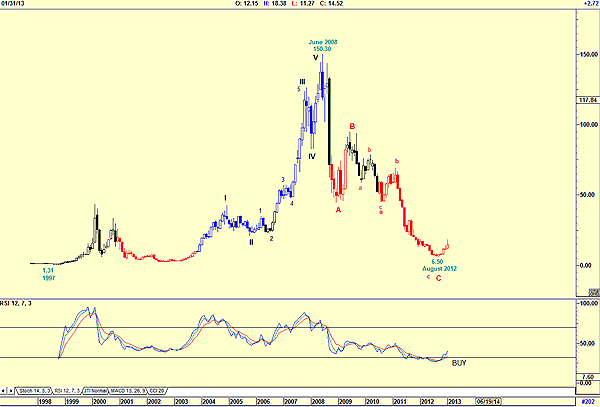
| FIGURE 1: RIM, MONTHLY |
| Graphic provided by: AdvancedGET. |
| |
| Figure 1 is a monthly chart of RIM, and shows how the share price rose from a low of $1.31 in 1997, to a high of $150.30 by June 2008, and then fell in an ABC correction to a low of $6.50 by August 2012. The chart shows an Elliott wave count with the C-wave complete, and the relative strength index (RSI) suggesting a buy. So, do we buy? |

|
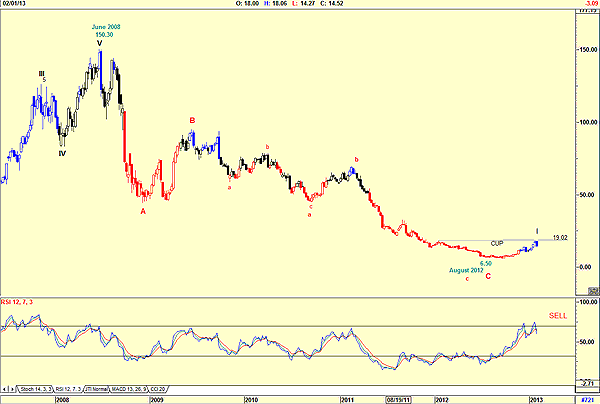
| FIGURE 2: RIM, WEEKLY |
| Graphic provided by: AdvancedGET. |
| |
| Figure 2, a weekly chart of RIM says no, don't buy. The chart is suggesting that a wave II could be on the cards. This is confirmed by the RSI, which is oversold and suggesting a sell signal. Note the cup and handle formation that is forming, with a buy signal only, should the price break above $19.02. |

|
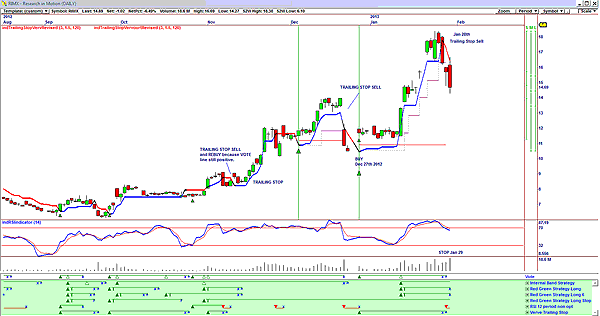
| FIGURE 3: RIM, DAILY |
| Graphic provided by: OmniTrader. |
| |
| Figure 3 is a daily chart that shows me buy/sell indicators in the vote line. In the vote line you can see the buy signals given -- a summation of the strategies below the vote line. The chart also shows the trailing stop. When a price breaks below the trailing stop, we should sell, even if the vote line is still in buy mode. However, when the price breaks above the trailing stop and the vote line is still in buy mode, we should buy the stock. I have shown this on the chart. Do note that on January 28, the price of RIM broke below the trailing stop, giving a sell signal. The vote line only stopped out on January 29 on an RSI sell signal. I would not be a buyer of RIM at the moment. The monthly chart, however, does say that I should watch the share. Once the vote line in the daily chart suggests a buy, I shall definitely be a buyer. |
Has been a technical analyst since 1969, and has worked as a futures and options trader with First Financial Futures in Johannesburg, South Africa.
| Address: | 3256 West 24th Ave |
| Vancouver, BC | |
| Phone # for sales: | 6042634214 |
| E-mail address: | petroosp@gmail.com |
Click here for more information about our publications!
PRINT THIS ARTICLE

Request Information From Our Sponsors
- StockCharts.com, Inc.
- Candle Patterns
- Candlestick Charting Explained
- Intermarket Technical Analysis
- John Murphy on Chart Analysis
- John Murphy's Chart Pattern Recognition
- John Murphy's Market Message
- MurphyExplainsMarketAnalysis-Intermarket Analysis
- MurphyExplainsMarketAnalysis-Visual Analysis
- StockCharts.com
- Technical Analysis of the Financial Markets
- The Visual Investor
- VectorVest, Inc.
- Executive Premier Workshop
- One-Day Options Course
- OptionsPro
- Retirement Income Workshop
- Sure-Fire Trading Systems (VectorVest, Inc.)
- Trading as a Business Workshop
- VectorVest 7 EOD
- VectorVest 7 RealTime/IntraDay
- VectorVest AutoTester
- VectorVest Educational Services
- VectorVest OnLine
- VectorVest Options Analyzer
- VectorVest ProGraphics v6.0
- VectorVest ProTrader 7
- VectorVest RealTime Derby Tool
- VectorVest Simulator
- VectorVest Variator
- VectorVest Watchdog
