HOT TOPICS LIST
- MACD
- Fibonacci
- RSI
- Gann
- ADXR
- Stochastics
- Volume
- Triangles
- Futures
- Cycles
- Volatility
- ZIGZAG
- MESA
- Retracement
- Aroon
INDICATORS LIST
LIST OF TOPICS
PRINT THIS ARTICLE
by Billy Williams
Entries without risk control and trade management are a guaranteed way to lose money, but using this simple system of moving average violations can keep you safe and profitable.
Position: Hold
Billy Williams
Billy Williams has been trading the markets for 27 years, specializing in momentum trading with stocks and options.
PRINT THIS ARTICLE
SIMPLE MA
Moving Average Violations
01/31/13 08:38:25 AMby Billy Williams
Entries without risk control and trade management are a guaranteed way to lose money, but using this simple system of moving average violations can keep you safe and profitable.
Position: Hold
| At first glance, trend trading, breakout trading, pullback trading, momentum trading, and all the various methods and systems of trading outline dynamic entry rules based on their underlying philosophies as well as individual criteria, but few methods and/or systems offer much guidance on how to manage a trade once an entry is made. An entry without a method of risk control and method of managing the trade is the leading cause to the effect that follows, commonly referred to as "What The Heck Do I Do Now Zone?" It's not the fault of most traders who get sucked into the emotional frenzy of observing marketing experts run through examples of entering a given trade and then detailing its climb to breathtaking heights of profitability using the latest indicator or secret entry system. At some level, you have to appreciate the level of marketing skill done to capture a trader's attention in order to put themselves into the trade as if it were happening in real-time while they picture themselves banking those profits over and over again. But anyone touting a trading method without a means of controlling the risk is only covering a small part of a viable system that has virtually no chance of surviving first contact with the market. Why? |

|
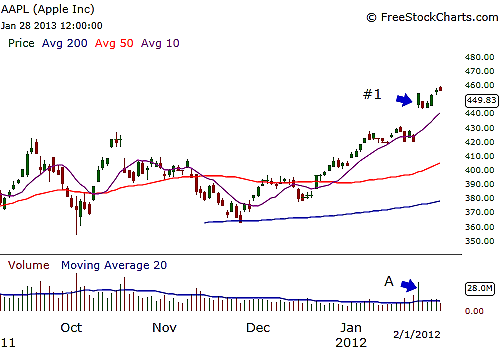
| FIGURE 1: AAPL. On January 25, 2012, a pocket pivot signals an entry in Apple Inc. at point 1 and confirmed by spike in volume higher than the previous 10 trading days and 50% higher than average at point A. |
| Graphic provided by: www.freestockcharts.com. |
| |
| Because it's easy enough to enter a position in an underlying security but without a plan on what to do afterward, you're entering the What The Heck Do I Do Now Zone? without a doubt. If you find yourself in this lonely, heartless land, you and your money are seriously at risk. Now, entry methods are critical in that they pinpoint the optimal point in time to take a position, once a given set of criteria are in place based on the trading method you happen to be using. However, they are literally just one small piece of the overall puzzle. In my previous articles, pocket pivots and buyable gaps were adaptive responses for breakout trading that evolved out of necessity due to the trendless, range-bound market that has been in force since the dotcom crash of 1999. (See Figure 1.) They are effective and they are reliable, but as mentioned previously, they are only one part of the overall approach. Moving averages have been around for decades because they offer a quick visual reference on the average price action that has been taking place for a specified period of time. |

|
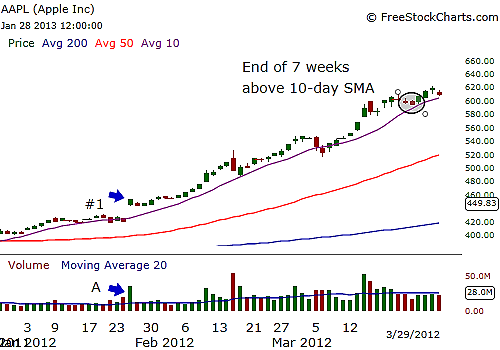
| FIGURE 2: AAPL. Price climbed higher with a vengeance, and near the end of March, it completed trading seven weeks above its 10-day SMA and moving into the second phase of its risk control criteria, exiting at a violation below the 10-day SMA. |
| Graphic provided by: www.freestockcharts.com. |
| |
| To round out the entry methods for breakout trading -- pocket pivots and buyable gaps, in this case -- there are a key set of rules to help you manage the trade while, at the same time, gaining the ability to control your risk to a high degree. The system of risk control is based on a set of rules defining what moving average violations are and how to use them to manage the trade. Once an entry is made, price will trade above the 10-day simple moving average (SMA) and the 50-day SMA. When price closes below the 10-day SMA, the first condition has been set for a potential violation by the price bar's intraday low, if the following price bars trade below the intraday low of the initial price bar that closed below the 10-day SMA, signaling a moving average violation. |

|
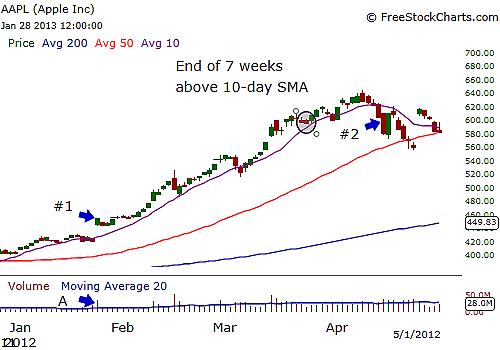
| FIGURE 3: AAPL. On April 13, 2012, weakness appeared to be creating a drag on Apple's price action as price closed below the 10-day SMA on April 13. An exit is confirmed as price trades below April 13's intraday low. Profits are locked in and the position is liquidated. |
| Graphic provided by: www.freestockcharts.com. |
| |
| The stop is then established at the 50-day SMA so if price continues to fall, the stop is set at the 50-day SMA. However, if price stays above the 10-day SMA for seven straight weeks without the moving average violation as defined, then you will exit at the first violation of the 10-day SMA without conceding to the 50-day SMA. See Figures 2 and 3. Often, the 50-day SMA provides support since big institutions watch the moving average closely, so if price falls below it within the seven-week time period, price will often find support and continue to display constructive price action. If not, a quick exit terminates the trade and provides protection for your trade capital. |
| In the second example, if momentum is strong enough to keep price above the 10-day SMA for seven straight weeks, then you'll stay in the trade long enough to ride its momentum and take profits at the first sign of weakness. Moving average violations offer you a strong visual reference in how price is playing out while also offering a method for managing the trade, taking profits, and avoiding losses as well as a perfect complement to your trading approach and entries. |
Billy Williams has been trading the markets for 27 years, specializing in momentum trading with stocks and options.
| Company: | StockOptionSystem.com |
| E-mail address: | stockoptionsystem.com@gmail.com |
Traders' Resource Links | |
| StockOptionSystem.com has not added any product or service information to TRADERS' RESOURCE. | |
Click here for more information about our publications!
Comments

|

Request Information From Our Sponsors
- VectorVest, Inc.
- Executive Premier Workshop
- One-Day Options Course
- OptionsPro
- Retirement Income Workshop
- Sure-Fire Trading Systems (VectorVest, Inc.)
- Trading as a Business Workshop
- VectorVest 7 EOD
- VectorVest 7 RealTime/IntraDay
- VectorVest AutoTester
- VectorVest Educational Services
- VectorVest OnLine
- VectorVest Options Analyzer
- VectorVest ProGraphics v6.0
- VectorVest ProTrader 7
- VectorVest RealTime Derby Tool
- VectorVest Simulator
- VectorVest Variator
- VectorVest Watchdog
- StockCharts.com, Inc.
- Candle Patterns
- Candlestick Charting Explained
- Intermarket Technical Analysis
- John Murphy on Chart Analysis
- John Murphy's Chart Pattern Recognition
- John Murphy's Market Message
- MurphyExplainsMarketAnalysis-Intermarket Analysis
- MurphyExplainsMarketAnalysis-Visual Analysis
- StockCharts.com
- Technical Analysis of the Financial Markets
- The Visual Investor
