HOT TOPICS LIST
- MACD
- Fibonacci
- RSI
- Gann
- ADXR
- Stochastics
- Volume
- Triangles
- Futures
- Cycles
- Volatility
- ZIGZAG
- MESA
- Retracement
- Aroon
INDICATORS LIST
LIST OF TOPICS
PRINT THIS ARTICLE
by Koos van der Merwe
Those who are not technicians are looking at a triple top.
Position: Hold
Koos van der Merwe
Has been a technical analyst since 1969, and has worked as a futures and options trader with First Financial Futures in Johannesburg, South Africa.
PRINT THIS ARTICLE
ELLIOTT WAVE
The Standard & Poor's 500 Revisited
01/31/13 08:12:19 AMby Koos van der Merwe
Those who are not technicians are looking at a triple top.
Position: Hold
| There is no doubt that the US economy is improving. Statistics that are coming through are all leaning to the positive side. Of course, there are exceptions; Apple stock is the one capturing everyone's attention, but AAPL is listed on NASDAQ. The index we should look at for market direction is the Standard & Poor's 500. The Dow Jones Industrial Average (DJIA) only looks at 30 stocks. So what are the charts telling us? |

|
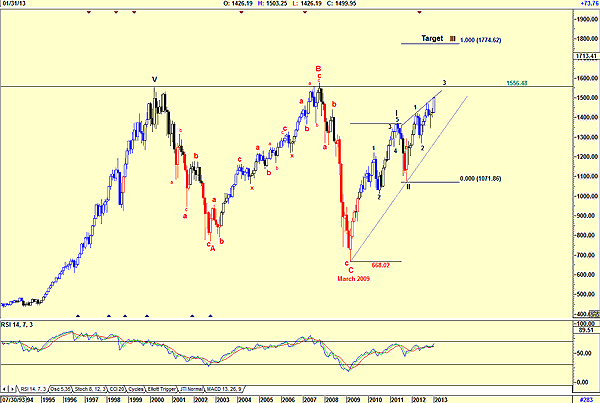
| FIGURE 1: S&P 500, MONTHLY |
| Graphic provided by: AdvancedGET. |
| |
| Figure 1 is a monthly chart of the S&P 500. Elliotticians know that a major ABC correction was completed in March 2009 when the index fell to 668.02. Since then, the index has been rising in a bull market. This can be confirmed simply by looking at the relative strength index (RSI), which is still in a bull trend after giving a buy in March 2009. Nontechnicians, however, will look at the triple top that appears to be forming and could probably sell into it, fearful that another market collapse could occur. A triple top is characterized by a rise to a certain level, followed by a reversal down then a retest of the higher level. This forms a resistance line where sellers judge the index to be a good short. Traders can take profits as the index approaches the resistance line, and start buying only when the index penetrates the resistance line or when any indicator they follow suggests a buy. Elliotticians will look for a wave correction and either sell on the correction or make a decision to hold depending on the severity of the wave they have analyzed. In Figure 1, I am looking for a wave 4 correction, which will be a complicated wave because wave 2 was a simple wave. This could tie in with the "Sell in May and go away" maxim, when the index could correct until end of September before moving into a wave 5 of wave III. The target for a wave III top is 1774.62, shown on the chart. This is determined by a Fibonacci extension of wave I. |

|
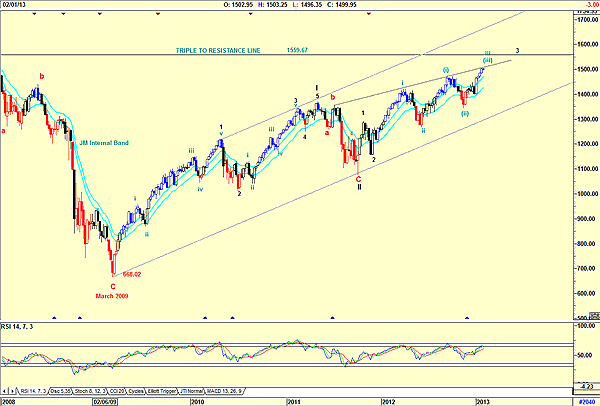
| FIGURE 2: S&P 500, WEEKLY |
| Graphic provided by: AdvancedGET. |
| |
| The weekly chart in Figure 2 shows the wave count as the index approaches the triple-top resistance line. The chart is suggesting a wave (iv) of wave iii of wave 3 of wave III is on the cards. Sound complicated? Yes, but a wave III can become very complicated as new highs are reached. The index is still above the upper band of the JM internal band. The RSI could give a sell signal, as it is in overbought territory and with the index testing the upper resistance line, a correction could be on the cards. The triple-top formation, expected by nontechnicians, looks very real, and I do expect a correction as the index approaches the 1559.67 resistance level. However, my Elliott wave count suggests that the correction could be an opportunity for further buying, with a major correction only occurring in May 2013. However, if we believe that there is an improvement in the global economy, this correction offers a good buying opportunity. |
Has been a technical analyst since 1969, and has worked as a futures and options trader with First Financial Futures in Johannesburg, South Africa.
| Address: | 3256 West 24th Ave |
| Vancouver, BC | |
| Phone # for sales: | 6042634214 |
| E-mail address: | petroosp@gmail.com |
Click here for more information about our publications!
PRINT THIS ARTICLE

|

Request Information From Our Sponsors
- StockCharts.com, Inc.
- Candle Patterns
- Candlestick Charting Explained
- Intermarket Technical Analysis
- John Murphy on Chart Analysis
- John Murphy's Chart Pattern Recognition
- John Murphy's Market Message
- MurphyExplainsMarketAnalysis-Intermarket Analysis
- MurphyExplainsMarketAnalysis-Visual Analysis
- StockCharts.com
- Technical Analysis of the Financial Markets
- The Visual Investor
- VectorVest, Inc.
- Executive Premier Workshop
- One-Day Options Course
- OptionsPro
- Retirement Income Workshop
- Sure-Fire Trading Systems (VectorVest, Inc.)
- Trading as a Business Workshop
- VectorVest 7 EOD
- VectorVest 7 RealTime/IntraDay
- VectorVest AutoTester
- VectorVest Educational Services
- VectorVest OnLine
- VectorVest Options Analyzer
- VectorVest ProGraphics v6.0
- VectorVest ProTrader 7
- VectorVest RealTime Derby Tool
- VectorVest Simulator
- VectorVest Variator
- VectorVest Watchdog
