HOT TOPICS LIST
- MACD
- Fibonacci
- RSI
- Gann
- ADXR
- Stochastics
- Volume
- Triangles
- Futures
- Cycles
- Volatility
- ZIGZAG
- MESA
- Retracement
- Aroon
INDICATORS LIST
LIST OF TOPICS
PRINT THIS ARTICLE
by Matt Blackman
Two weeks ago, I made the case for more downside on Apple. After mounting a weak rally, it resumed its downtrend with a vengeance.
Position: Sell
Matt Blackman
Matt Blackman is a full-time technical and financial writer and trader. He produces corporate and financial newsletters, and assists clients in getting published in the mainstream media. He is the host of TradeSystemGuru.com. Matt has earned the Chartered Market Technician (CMT) designation. Find out what stocks and futures Matt is watching on Twitter at www.twitter.com/RatioTrade
PRINT THIS ARTICLE
HEAD & SHOULDERS
Apple, From Soft To Sour
01/28/13 08:41:47 AMby Matt Blackman
Two weeks ago, I made the case for more downside on Apple. After mounting a weak rally, it resumed its downtrend with a vengeance.
Position: Sell
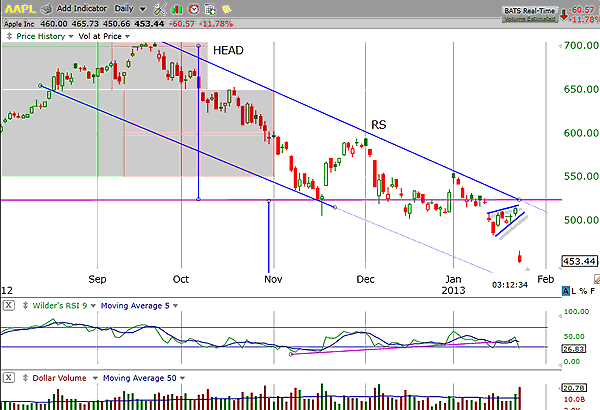
| In my TCA article, "Apple Falling Farther From The Tree" (http://goo.gl/GqQZk), I made the bearish case for the stock based on the chart patterns that were apparent. One week, a weak rally, and -$35 later, the bearish case for Apple Inc. (AAPL) remains very much intact. See Figure 1. |

|
| FIGURE 1: AAPL, DAILY. Daily chart for Apple showing the right side of the bearish head & shoulders pattern, neckline, downsloping channel and recent bearish rising wedge followed by yet another gap down in the wake of disappointing revenues from the company. |
| Graphic provided by: TC2000.com. |
| |
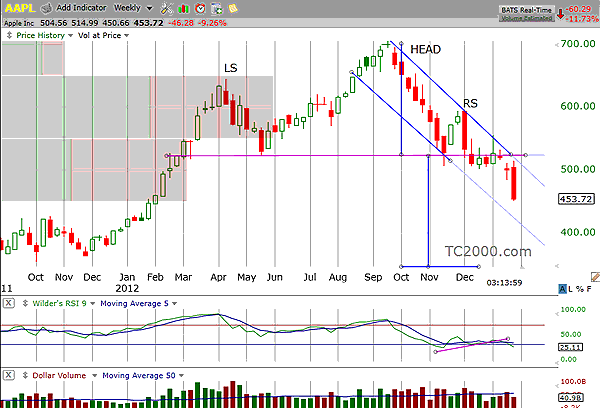
| On January 23, the company reported first-quarter revenue of $54.5 billion, which was below analyst consensus of $54.9 billion. But the real kicker was the big drop in expected revenue for the second quarter -- $41 to $43 billion versus the current Wall Street view of $45.7 billion according to Comtex. Not surprisingly, it was enough to cause analysts at Jefferies to downgrade the stock from buy to hold. AAPL closed the next trading day down 12.4% with a drop of $63.53 per share. Technically, the move came on the heels of a bearish wedge pattern that began to form January 14 and the pattern was confirmed by declining volume until the stock again gapped down. At $450, AAPL has fallen $75 from its head & shoulder neckline and is now $100 from the minimum projected target of $350 for the pattern, assuming the downtrend continues (see Figure 2). |

|
| FIGURE 2: AAPL, WEEKLY. The weekly chart of AAPL showing the year-long head & shoulders pattern forming followed by the hold but then violent breakthrough the neckline and longer-term steep downtrend channel. The minimum projected target for this pattern is $350. |
| Graphic provided by: TC2000.com. |
| |
| So what kind of signs should traders be watching for that the worst is over for AAPL? The spike in selling dollar volume of more than $22.4 billion on January 24 was the largest red day since March 15, 2012, and it could be the first phase of a capitulation. However, capitulations on stocks like AAPL in which there is still so much bullishness can take a while to complete. In other words, there are many retail traders who still love the stock and believe that it will reverse course soon. Unfortunately for them, there are more significant down days to come that will cause the weak hands to flee the stock in ever-increasing numbers before the worst is finally over. Like we saw with Facebook, this process can take five or six months and the low often occurs on low volume, which shows that all who are going to sell have done so. |
| Before we can safely say that AAPL has bottomed, we need to see complete capitulation followed by a series of higher lows and higher highs, which shows the strong hands again accumulating the stock. Without this proof, buying is nothing more than that death-defying stunt of trying to catch a falling knife. As any trader worth his or her salt knows, that is a very good way to toast both your trading account and market self confidence in one fell swoop. |
Matt Blackman is a full-time technical and financial writer and trader. He produces corporate and financial newsletters, and assists clients in getting published in the mainstream media. He is the host of TradeSystemGuru.com. Matt has earned the Chartered Market Technician (CMT) designation. Find out what stocks and futures Matt is watching on Twitter at www.twitter.com/RatioTrade
| Company: | TradeSystemGuru.com |
| Address: | Box 2589 |
| Garibaldi Highlands, BC Canada | |
| Phone # for sales: | 604-898-9069 |
| Fax: | 604-898-9069 |
| Website: | www.tradesystemguru.com |
| E-mail address: | indextradermb@gmail.com |
Traders' Resource Links | |
| TradeSystemGuru.com has not added any product or service information to TRADERS' RESOURCE. | |
Click here for more information about our publications!
Comments

Request Information From Our Sponsors
- StockCharts.com, Inc.
- Candle Patterns
- Candlestick Charting Explained
- Intermarket Technical Analysis
- John Murphy on Chart Analysis
- John Murphy's Chart Pattern Recognition
- John Murphy's Market Message
- MurphyExplainsMarketAnalysis-Intermarket Analysis
- MurphyExplainsMarketAnalysis-Visual Analysis
- StockCharts.com
- Technical Analysis of the Financial Markets
- The Visual Investor
- VectorVest, Inc.
- Executive Premier Workshop
- One-Day Options Course
- OptionsPro
- Retirement Income Workshop
- Sure-Fire Trading Systems (VectorVest, Inc.)
- Trading as a Business Workshop
- VectorVest 7 EOD
- VectorVest 7 RealTime/IntraDay
- VectorVest AutoTester
- VectorVest Educational Services
- VectorVest OnLine
- VectorVest Options Analyzer
- VectorVest ProGraphics v6.0
- VectorVest ProTrader 7
- VectorVest RealTime Derby Tool
- VectorVest Simulator
- VectorVest Variator
- VectorVest Watchdog
