HOT TOPICS LIST
- MACD
- Fibonacci
- RSI
- Gann
- ADXR
- Stochastics
- Volume
- Triangles
- Futures
- Cycles
- Volatility
- ZIGZAG
- MESA
- Retracement
- Aroon
INDICATORS LIST
LIST OF TOPICS
PRINT THIS ARTICLE
by Gary Grosschadl
The Oil Index (Amex XOI)has enjoyed a 10-year uptrend as witnessed on its weekly chart. There are signs of weakness appearing, which bears monitoring.
Position: N/A
Gary Grosschadl
Independent Canadian equities trader and technical analyst based in Peterborough
Ontario, Canada.
PRINT THIS ARTICLE
CHART ANALYSIS
Oil Index On A Slippery Slope
08/02/02 01:25:54 PMby Gary Grosschadl
The Oil Index (Amex XOI)has enjoyed a 10-year uptrend as witnessed on its weekly chart. There are signs of weakness appearing, which bears monitoring.
Position: N/A
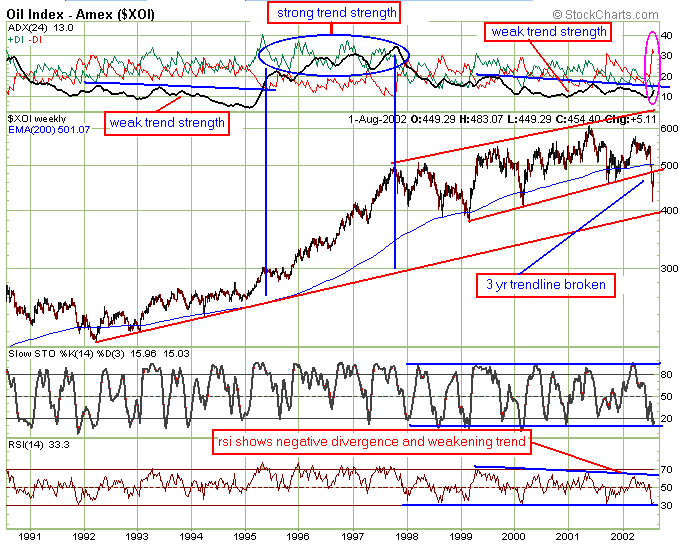
| A three year trendline has been broken to the downside. This is likely related to all the market upheaval as of late but let's judge it by its own merit. The chart shows brief violations of the 200 day EMA but this latest one cuts deeper with the trendline breach. Further weakness may challenge the 10-year trendline, which could bring the index down to the 400 level. Should the index then lose its battle to stay above the 200-day EMA, an important trend change would occur. An oil bear might start ruling the oil fields. |
| The RSI as displayed on the chart shows a weakening trend. It has not been able to hit the 70 level since 1999 and this shows negative divergence to the last high of over 600 on the index. This served as an early warning sign and was proven correct as the index came well off its peak. |

|
| |
| The Directional Movement Indicator, my favourite trend strength tool has an interesting history here. |
| The ADX clearly shows that over a 10-year period, the rapid upleg of this index fell between 2 periods of rather choppy trendless action. As a rule of thumb, strong directional movement or trend strength is characterized by an ADX greater than 20, in a rising trend, ideally staying between both DI's with the positive DI (showing the bulls or buyers firmly in control) on top. |
| On the left side of the ADX "chart" you see a trend change occur as the ADX broke its own trendline and moved north of 20. This ushered in 3 years of a powerful uptrend. This time on the right side of the chart you see the danger of a very bearish change in trend, should history repeat, this time with opposite consequences. Note the implications of the ADX once again rising above its trendline and above the 20 level. This time with - DI being on top, the bears would rule the oil fields for as long as this directional movement holds its course. We are not there yet, but this ominous looking trend in its very early build-up could have powerful ramifications down the line. In the meantime as the stochastics oscillator shows, traders can partially (but effectively) base their buy and sell decisions from movements of oversold to overbought extremes of above 80 and below 20. |
Independent Canadian equities trader and technical analyst based in Peterborough
Ontario, Canada.
| Website: | www.whatsonsale.ca/financial.html |
| E-mail address: | gwg7@sympatico.ca |
Click here for more information about our publications!
PRINT THIS ARTICLE

Request Information From Our Sponsors
- StockCharts.com, Inc.
- Candle Patterns
- Candlestick Charting Explained
- Intermarket Technical Analysis
- John Murphy on Chart Analysis
- John Murphy's Chart Pattern Recognition
- John Murphy's Market Message
- MurphyExplainsMarketAnalysis-Intermarket Analysis
- MurphyExplainsMarketAnalysis-Visual Analysis
- StockCharts.com
- Technical Analysis of the Financial Markets
- The Visual Investor
- VectorVest, Inc.
- Executive Premier Workshop
- One-Day Options Course
- OptionsPro
- Retirement Income Workshop
- Sure-Fire Trading Systems (VectorVest, Inc.)
- Trading as a Business Workshop
- VectorVest 7 EOD
- VectorVest 7 RealTime/IntraDay
- VectorVest AutoTester
- VectorVest Educational Services
- VectorVest OnLine
- VectorVest Options Analyzer
- VectorVest ProGraphics v6.0
- VectorVest ProTrader 7
- VectorVest RealTime Derby Tool
- VectorVest Simulator
- VectorVest Variator
- VectorVest Watchdog
