HOT TOPICS LIST
- MACD
- Fibonacci
- RSI
- Gann
- ADXR
- Stochastics
- Volume
- Triangles
- Futures
- Cycles
- Volatility
- ZIGZAG
- MESA
- Retracement
- Aroon
INDICATORS LIST
LIST OF TOPICS
PRINT THIS ARTICLE
by Koos van der Merwe
With technical analysis, we are always looking for an indicator or index that leads the market. This is not as easy as we think.
Position: Accumulate
Koos van der Merwe
Has been a technical analyst since 1969, and has worked as a futures and options trader with First Financial Futures in Johannesburg, South Africa.
PRINT THIS ARTICLE
WILDER'S RSI
Looking For A Leader
01/28/13 12:44:34 PMby Koos van der Merwe
With technical analysis, we are always looking for an indicator or index that leads the market. This is not as easy as we think.
Position: Accumulate
| In trying to find an indicator or exchange traded fund (ETF) that can predict the stock market, I have looked at the CBOE volatility index (VIX), referred to on CNBC as being a leader; the Fisher Gartman ON and OFF ETF; and the RSI 14-period indicator. The results of my search are shown in Figure 1. |

|
| FIGURE 1: ETFS. Down with F-G ON and F-G OFF superimposed. |
| Graphic provided by: MetaStock. |
| |
| Figure 1 is the Fisher-Gartman Risk ON ETF and the Fisher Gartman Risk OFF ETF superimposed on a chart of the Dow Jones Industrial Average (DJIA). No sign of a future trend is shown. The two ETFs appear to follow the DJIA's movement. The Fisher-Gartman ON rises with the DJIA, and the Fisher-Gartman OFF falls as the DJIA rises, almost a mirror image of each other. Turning points in both are not preceding that of the DJIA. What they could be telling us, and because they have been designed to measure risk, is that with the rise of the DJIA, risk of investment increases. However, looking at the chart, we can see that when the DJIA fell on December 19, the Fisher-Gartman ONN moved sideways, suggesting that the DJIA would rise. The distance between the F-G ON and the F-G OFF charts intrigued me. Could that be a sign forecasting the trend of the DJIA? I created the chart in Figure 2 to determine this. |

|
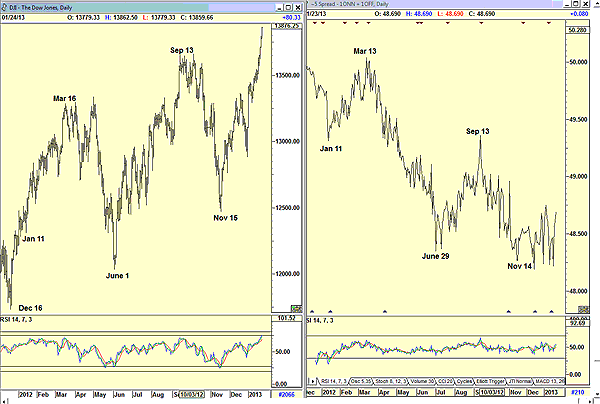
| FIGURE 2: DJIA. DJIA with F-G spread. |
| Graphic provided by: AdvancedGET. |
| |
| Figure 2 is a chart of the DJIA and a chart where I have subtracted the F-G ON ETF from the F-G OFF ETF. I expected the result to be a straight line, and it wasn't. I then looked to see whether it would predict the DJIA's movement as I hoped it would and found that it could to a degree. It did forecast the March 16th correction of the DJIA by three days, but it did not forecast the rise in the DJIA from June 1. On September 13, it called for a fall in the DJIA, and this did happen. From November 14, it is moving sideways and the DJIA is rising, suggesting that the rise in the DJIA could be risky. |

|
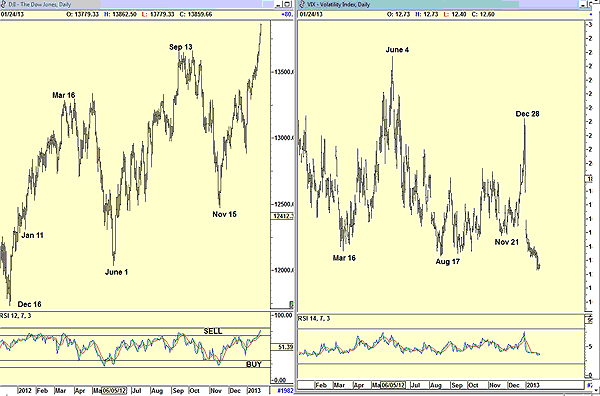
| FIGURE 3: DJIA WITH VIX |
| Graphic provided by: AdvancedGET. |
| |
| Figure 3 is a chart of the DJIA and the VIX. Once again, a forecast of the DJIA trend is not obvious. However, we should note that the VIX moves opposite to the DJIA, and when the VIX is at highs or lows, a trend change is in the wind and could occur. The dates shown on both charts, however, do not anticipate future movement, but simply suggest that it could happen. Do note the relative strength index (RSI), and here I am using a 12-period indicator that suggests a far more accurate change in trend. Many have tried to develop an indicator or ETF to forecast the movement of the DJIA. The Fisher-Gartman ON and OFF ETFs were not developed as a forecasting tool, but as an investment to buy should the DJIA rise or and buy as the DJIA falls because they both tend to follow the DJIA accurately. The VIX is a volatility measure and suggests that a change could occur or is about to occur. Those looking for an accurate trend indicator should still look to the RSI, proven to be reliable. |
Has been a technical analyst since 1969, and has worked as a futures and options trader with First Financial Futures in Johannesburg, South Africa.
| Address: | 3256 West 24th Ave |
| Vancouver, BC | |
| Phone # for sales: | 6042634214 |
| E-mail address: | petroosp@gmail.com |
Click here for more information about our publications!
Comments

Request Information From Our Sponsors
- StockCharts.com, Inc.
- Candle Patterns
- Candlestick Charting Explained
- Intermarket Technical Analysis
- John Murphy on Chart Analysis
- John Murphy's Chart Pattern Recognition
- John Murphy's Market Message
- MurphyExplainsMarketAnalysis-Intermarket Analysis
- MurphyExplainsMarketAnalysis-Visual Analysis
- StockCharts.com
- Technical Analysis of the Financial Markets
- The Visual Investor
- VectorVest, Inc.
- Executive Premier Workshop
- One-Day Options Course
- OptionsPro
- Retirement Income Workshop
- Sure-Fire Trading Systems (VectorVest, Inc.)
- Trading as a Business Workshop
- VectorVest 7 EOD
- VectorVest 7 RealTime/IntraDay
- VectorVest AutoTester
- VectorVest Educational Services
- VectorVest OnLine
- VectorVest Options Analyzer
- VectorVest ProGraphics v6.0
- VectorVest ProTrader 7
- VectorVest RealTime Derby Tool
- VectorVest Simulator
- VectorVest Variator
- VectorVest Watchdog
