

HOT TOPICS LIST
- MACD
- Fibonacci
- RSI
- Gann
- ADXR
- Stochastics
- Volume
- Triangles
- Futures
- Cycles
- Volatility
- ZIGZAG
- MESA
- Retracement
- Aroon
INDICATORS LIST
LIST OF TOPICS
PRINT THIS ARTICLE
by Donald W. Pendergast, Jr.
Shares of Agnico-Eagle Mines Ltd. enjoyed a bullish second half during 2012 and may again be poised for a tradable rally beginning within the next week or two.
Position: N/A
Donald W. Pendergast, Jr.
Freelance financial markets writer and online publisher of the Trendzetterz.com S&P 500 Weekly Forecast service.
PRINT THIS ARTICLE
SUPPORT & RESISTANCE
AEM Approaching A Low-Risk Buy Zone?
01/25/13 09:32:58 AMby Donald W. Pendergast, Jr.
Shares of Agnico-Eagle Mines Ltd. enjoyed a bullish second half during 2012 and may again be poised for a tradable rally beginning within the next week or two.
Position: N/A
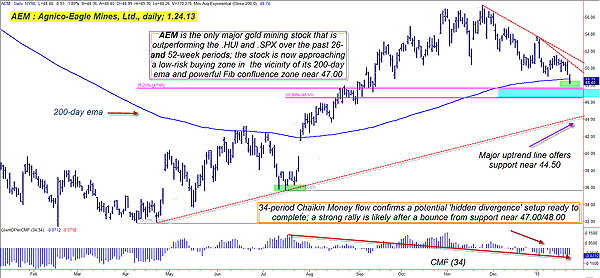
| Gold bugs are passionate about their favorite mining stocks, and one of the stocks that might be cause for a new round of bullish enthusiasm in the otherwise poor-performing universe of large cap gold miners are shares of Agnico-Eagle Mines Ltd. (AEM). It's the only major gold mining stock that is outperforming the .HUI and .SPX over the past 26 and 52 weeks and appears to be closing in an a very low-risk long entry area, prior to what could turn into a strong rally. Here's a closer look now (Figures 1 and 2). |
|
| FIGURE 1: AEM, DAILY. When a long-term, high relative strength stock pulls back toward major support at the same time that a pronounced hidden divergence appears, savvy bulls will start looking for creative put selling strategies to profit from a potential rally. |
| Graphic provided by: TradeStation. |
| |
| AEM shares made a major multicycle low (confirmed) on April 10, 2012, and then proceeded to climb by nearly 80% by late November 2012; a major, long term uptrend line was set in place by that powerful rally (lower trendline on chart), and AEM is still trading comfortably above that key dividing line of bulls and bears. The stock has dipped below its 200-day exponential moving average (EMA), however, and it will be interesting to see if the selling picks up or if value-hungry buyers come to the rescue if the stocks declines into the 47.00-48.00 area, which is a key Fibonacci confluence support zone (blue rectangle on Figure 1). Probabilities would seem to favor that AEM will indeed make a significant cycle low somewhere between 47.00-48.00, especially since the 34-period Chaikin money flow histogram (CMF)(34) is providing evidence of a lovely hidden divergence pattern against price action on the chart. To visualize this, locate the two swing lows with a green box just beneath; the recent swing lower is at a much higher price level than the one made back in July 2012. At the same time, look at the money flow histogram (bottom of chart); it was in positive territory in July 2012 and it is now in the negative (bearish) zone on this latest decline. This is confirmation of a hidden divergence, and what it's telling traders and investors is that AEM is ripe for a bounce soon, if not a renewed, sustained rally after the current swing exhausts itself. All in all, chances are very good to see AEM make a tradable bounce, possibly followed by a strong retracement move back up toward the 53.00 to 55.00 area between now and mid-March 2013. |
|
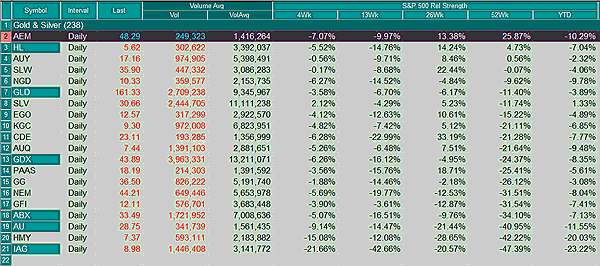
| FIGURE 2: GOLD & SILVER. Agnico-Eagle (AEM) is the only large-cap, high-volume gold mining stock that is currently outperforming both the .SPX and .HUI over the past 26- and 52-week periods. |
| Graphic provided by: TradeStation. |
| Graphic provided by: TradeStation Radar Screen. |
| |
| A simple, yet potentially effective short-term play is to sell a March 2013 AEM $42.50 put option, but only once you have some degree of confidence that the stock has finally reversed higher. A daily close back above the 200-day EMA and/or the 49.31 level might be a great time to sell this particular put, one that offers the following: 1. Its strike price is far below all of the support levels depicted on the chart, thus offering a substantial amount of protection. 2. The bullish technicals, taken as a whole, imply a higher degree of confidence that the bullish turn will happen sooner rather than later, and that a strong rally may ensue. Conservative traders may want to scale in to such a put position, adding contracts on strength (but not on weakness), always keeping their total account risk at 2% or less for the entire position. If the put(s) increase in value by 80-85%, buy them back for a loss, and if they decline in value by 50% to 60%, do the same thing, only this time at a profit. Trade wisely until we meet here again. |
Freelance financial markets writer and online publisher of the Trendzetterz.com S&P 500 Weekly Forecast service.
| Title: | Market consultant and writer |
| Company: | Trendzetterz |
| Address: | 81 Hickory Hollow Drive |
| Crossville, TN 38555 | |
| Phone # for sales: | 904-303-4814 |
| Website: | trendzetterz.com |
| E-mail address: | support@trendzetterz.com |
Traders' Resource Links | |
| Trendzetterz has not added any product or service information to TRADERS' RESOURCE. | |
Click here for more information about our publications!
PRINT THIS ARTICLE

Request Information From Our Sponsors
- StockCharts.com, Inc.
- Candle Patterns
- Candlestick Charting Explained
- Intermarket Technical Analysis
- John Murphy on Chart Analysis
- John Murphy's Chart Pattern Recognition
- John Murphy's Market Message
- MurphyExplainsMarketAnalysis-Intermarket Analysis
- MurphyExplainsMarketAnalysis-Visual Analysis
- StockCharts.com
- Technical Analysis of the Financial Markets
- The Visual Investor
- VectorVest, Inc.
- Executive Premier Workshop
- One-Day Options Course
- OptionsPro
- Retirement Income Workshop
- Sure-Fire Trading Systems (VectorVest, Inc.)
- Trading as a Business Workshop
- VectorVest 7 EOD
- VectorVest 7 RealTime/IntraDay
- VectorVest AutoTester
- VectorVest Educational Services
- VectorVest OnLine
- VectorVest Options Analyzer
- VectorVest ProGraphics v6.0
- VectorVest ProTrader 7
- VectorVest RealTime Derby Tool
- VectorVest Simulator
- VectorVest Variator
- VectorVest Watchdog