HOT TOPICS LIST
- MACD
- Fibonacci
- RSI
- Gann
- ADXR
- Stochastics
- Volume
- Triangles
- Futures
- Cycles
- Volatility
- ZIGZAG
- MESA
- Retracement
- Aroon
INDICATORS LIST
LIST OF TOPICS
PRINT THIS ARTICLE
by Billy Williams
As market types change from up, down, or sideways, entry methods have to adapt as well.
Position: Hold
Billy Williams
Billy Williams has been trading the markets for 27 years, specializing in momentum trading with stocks and options.
PRINT THIS ARTICLE
GAPS
Buyable Gap-Ups
01/24/13 12:06:26 PMby Billy Williams
As market types change from up, down, or sideways, entry methods have to adapt as well.
Position: Hold
| In trading, one of the most effective things that you can do when designing a reliable trading method or system is to develop a unique set of nonobvious entry methods to help capitalize on the market's movement. In one of my previous articles, I detailed how momentum trading in particular has evolved into a trading model that has adapted to the trendless market that is under way and resulted in too few breakouts with many of them failing. The momentum model is adjusted by hard-core disciples of the method designing new methods of entry like the pocket pivot to adjust for the false breakouts and gain a foothold early on before the stock gathers steam and breaks out to higher ground. Likewise, a new variation on an old trading pattern -- the price gap -- has proven a reliable means to enter a move that is breaking to higher ground and offers the trader the chance to create and/or build a position. |
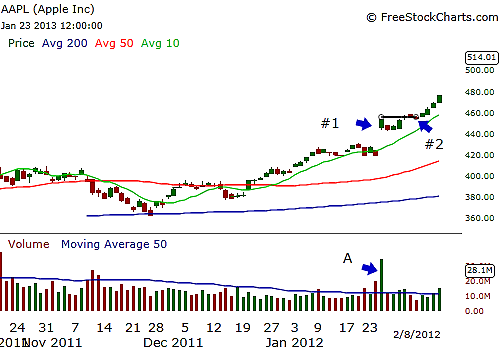
| Price gaps occur when there is an imbalance between buying and selling of a stock, which causes it to open higher than its previous close in a bullish environment and is often accompanied by higher trade volume. Price and volume are like two sides of the same coin in that they have a direct relationship. When volume is gradually building during the accumulation phase where there are more buyers than sellers, then price is more likely to move in tandem and trend upward. However, when there is a change in the underlying context of a stock's movement such as a surprise in earnings, for example, it can result in a frenzy of buying as investors and traders leap into the stock en masse, resulting in an imbalance between the supply and demand for the stock. See Figure 1. |

|
| FIGURE 1: AAPL. In early 2012, demand for Apple's shares exploded as a buyable gap-up formed on January 25, 2012, which was signaled by a tremendous surge in trade volume in excess of the 150% seen at point A. If you entered on the day of the gap, at point 1, with a 7% to 8% stop, you would have remained in the position, but if you set your stop just below the day's intraday low, you could have been stopped out. However, a second entry was presented at point 2, when price traded above the new established intraday high after the stock's move was under way. |
| Graphic provided by: www.freestockcharts.com. |
| |
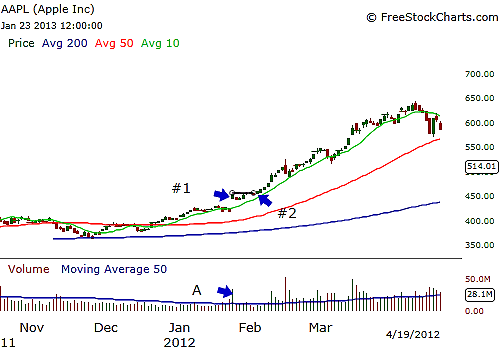
| The result is a gap in price as buyers buy up the supply of stock available and push its value higher than the previous day. The criteria for a buyable gap up is simple. The stock's price movement must be in a constructive sideways pattern, building a base or trending upward when price gaps higher than the previous close outside the previous trading day's total price range on trade volume, registering at least 50% higher than its 50-day moving average. For example, if a stock's 50-day average for its trading volume is one million shares, then you want to see volume register at 1.5 million shares or more the day that its price gaps up. See Figure 2. |

|
| FIGURE 2: AAPL. AAPL surged from the buyable gap-up entry point and gained just under 200 points before price started to decline around mid-April 2012, indicating that you needed to exit your position. |
| Graphic provided by: www.freestockcharts.com. |
| |
| When you first see a buyable gap-up develop, it can be difficult to take a position in the tradable because the move seems to be so much higher than the previous price range. However, that is precisely the reason you want to take the signal because it is often the first step to propelling to a higher price range. The beauty of this signal is that it has a built-in sell signal, which is the intraday low of the price gap itself. Plus, if you happen to get stopped out due to the price's wild movement gyrations, you can alway reenter as it trades above the intraday high that was established after the gap-up developed. As always, use stops and risk no more than 2% of your overall portfolio, and/or use stops 7% to 8% from your entry price. |
Billy Williams has been trading the markets for 27 years, specializing in momentum trading with stocks and options.
| Company: | StockOptionSystem.com |
| E-mail address: | stockoptionsystem.com@gmail.com |
Traders' Resource Links | |
| StockOptionSystem.com has not added any product or service information to TRADERS' RESOURCE. | |
Click here for more information about our publications!
Comments
Date: 01/31/13Rank: 2Comment:

Request Information From Our Sponsors
- StockCharts.com, Inc.
- Candle Patterns
- Candlestick Charting Explained
- Intermarket Technical Analysis
- John Murphy on Chart Analysis
- John Murphy's Chart Pattern Recognition
- John Murphy's Market Message
- MurphyExplainsMarketAnalysis-Intermarket Analysis
- MurphyExplainsMarketAnalysis-Visual Analysis
- StockCharts.com
- Technical Analysis of the Financial Markets
- The Visual Investor
- VectorVest, Inc.
- Executive Premier Workshop
- One-Day Options Course
- OptionsPro
- Retirement Income Workshop
- Sure-Fire Trading Systems (VectorVest, Inc.)
- Trading as a Business Workshop
- VectorVest 7 EOD
- VectorVest 7 RealTime/IntraDay
- VectorVest AutoTester
- VectorVest Educational Services
- VectorVest OnLine
- VectorVest Options Analyzer
- VectorVest ProGraphics v6.0
- VectorVest ProTrader 7
- VectorVest RealTime Derby Tool
- VectorVest Simulator
- VectorVest Variator
- VectorVest Watchdog
