HOT TOPICS LIST
- MACD
- Fibonacci
- RSI
- Gann
- ADXR
- Stochastics
- Volume
- Triangles
- Futures
- Cycles
- Volatility
- ZIGZAG
- MESA
- Retracement
- Aroon
INDICATORS LIST
LIST OF TOPICS
PRINT THIS ARTICLE
by Donald W. Pendergast, Jr.
Shares of Transocean Ltd. recently staged a stunning rally -- fundamentals and technicals are bullish, but a minor pullback is likely in the near term.
Position: N/A
Donald W. Pendergast, Jr.
Freelance financial markets writer and online publisher of the Trendzetterz.com S&P 500 Weekly Forecast service.
PRINT THIS ARTICLE
KELTNER CHANNELS
Transocean Ltd. Sees Strong Rally; Pullback Likely Near Term
01/24/13 08:05:31 AMby Donald W. Pendergast, Jr.
Shares of Transocean Ltd. recently staged a stunning rally -- fundamentals and technicals are bullish, but a minor pullback is likely in the near term.
Position: N/A
| Sometimes, a stock breaks out of a trading range with such speed and intensity that it causes a second look at its technicals and fundamentals. The recent surge higher in shares of Transocean Ltd. (RIG) is definitely worth examining to see if this is a rally with real, sustained power or just a flash in the pan move that's ready to crash and burn. Here's a closer look now (Figures 1 and 2). |

|
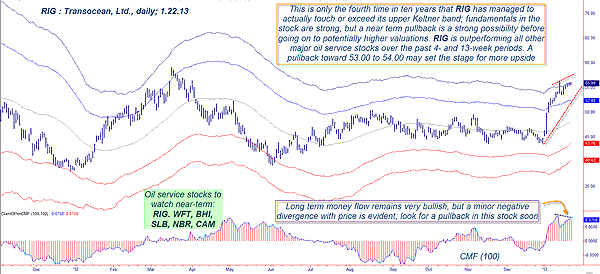
| FIGURE 1: RIG, DAILY. Most of the time, RIG trades within its set of inner Keltner channels, and touches or violations of its extreme upper and lower bands are extremely rare -- and noteworthy -- occurrences. |
| Graphic provided by: TradeStation. |
| |
| With two sets of Keltner channels overlaid on RIG's daily chart (Figure 1), we can get a sense of the typical -- and not so typical -- back-and-forth trading action in this major oil services issue. Analyzing the past 10 years of price action in this stock (only 14 months is shown here to focus on recent movements) reveals that on only four occasions has RIG touched and/or exceeded its extreme upper Keltner band; what we are witnessing now in RIG's latest rally is a rare and potentially profitable move that could travel significantly higher before a major correction or trend reversal begins. However, RIG's past history also suggests that after the first time the band is hit or exceeded, it is normal to see some sort of a pullback and that prices usually do not remain above the extreme upper band for more than a couple of weeks. Bear in mind that RIG has exceptionally good relative strength performance (over the past four and 13 weeks) against the .SPX and also its competitors in the oil services group and it would not be wise to attempt to pick a top here. Long-term money flow is also very bullish, although it is now manifesting a mildly bearish divergence with the price action of late. |

|
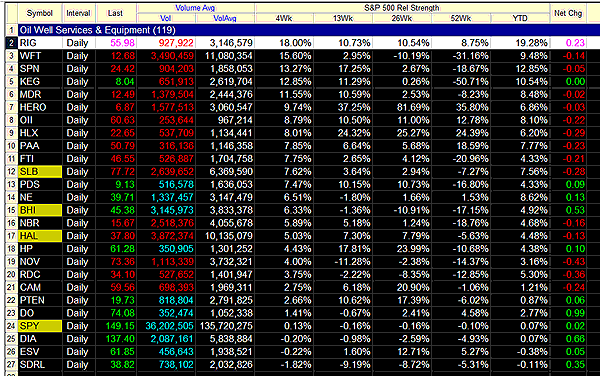
| FIGURE 2: OIL SERVICES STOCKS. RIG is outperforming all other major oil services stocks over the past four weeks (vs. the .SPX) and is off to a very bullish start in 2013. |
| Graphic provided by: TradeStation. |
| Graphic provided by: TradeStation Radar Screen. |
| |
| Here are a couple of ideas for playing RIG: 1. If $55.20 (the low on January 18, 2013) is breached to the downside, consider the purchase of a slightly in-the-money put with at least two months' time value, looking to capitalize on a potentially fast move down toward the next support level near $53.55. The March '13 $57.50 RIG put is selling for about $3.05 and the daily time decay is only $2 per day at present. Open interest is light, although it is better for the out-of-the money March $55 put. If filled on the put purchase, use $53.70 as your initial price target and use a two-bar trailing stop of the daily highs as your trade management and exit strategy. 2. Go long on a break above Tuesday's high of $56.02 and run the same kind of two-bar trailing stop (of the daily lows, of course); a solid break above the upper Keltner may bring in more late momentum buyers prior to a pullback, and that could provide another 1% to 2% in gains for this temporarily overextended stock. Consider setting a modest profit target for this strategy, especially if you are more conservative in nature. Risk no more than 2% of your account equity (and preferably no more than 1% on a countertrend strategies like these) and if you decide to go the put option route, by no means let the option decline by more than 50% if your profit target of stop-loss isn't hit for some reason. Trade wisely until we meet here again. |
Freelance financial markets writer and online publisher of the Trendzetterz.com S&P 500 Weekly Forecast service.
| Title: | Market consultant and writer |
| Company: | Trendzetterz |
| Address: | 81 Hickory Hollow Drive |
| Crossville, TN 38555 | |
| Phone # for sales: | 904-303-4814 |
| Website: | trendzetterz.com |
| E-mail address: | support@trendzetterz.com |
Traders' Resource Links | |
| Trendzetterz has not added any product or service information to TRADERS' RESOURCE. | |
Click here for more information about our publications!
Comments

Request Information From Our Sponsors
- StockCharts.com, Inc.
- Candle Patterns
- Candlestick Charting Explained
- Intermarket Technical Analysis
- John Murphy on Chart Analysis
- John Murphy's Chart Pattern Recognition
- John Murphy's Market Message
- MurphyExplainsMarketAnalysis-Intermarket Analysis
- MurphyExplainsMarketAnalysis-Visual Analysis
- StockCharts.com
- Technical Analysis of the Financial Markets
- The Visual Investor
- VectorVest, Inc.
- Executive Premier Workshop
- One-Day Options Course
- OptionsPro
- Retirement Income Workshop
- Sure-Fire Trading Systems (VectorVest, Inc.)
- Trading as a Business Workshop
- VectorVest 7 EOD
- VectorVest 7 RealTime/IntraDay
- VectorVest AutoTester
- VectorVest Educational Services
- VectorVest OnLine
- VectorVest Options Analyzer
- VectorVest ProGraphics v6.0
- VectorVest ProTrader 7
- VectorVest RealTime Derby Tool
- VectorVest Simulator
- VectorVest Variator
- VectorVest Watchdog
