HOT TOPICS LIST
- MACD
- Fibonacci
- RSI
- Gann
- ADXR
- Stochastics
- Volume
- Triangles
- Futures
- Cycles
- Volatility
- ZIGZAG
- MESA
- Retracement
- Aroon
INDICATORS LIST
LIST OF TOPICS
PRINT THIS ARTICLE
by Matt Blackman
By all accounts, the Facebook initial public offering was a poor showing. But now that the bloodletting appears to be over, can this stock join the ranks of Internet high-fliers?
Position: Buy
Matt Blackman
Matt Blackman is a full-time technical and financial writer and trader. He produces corporate and financial newsletters, and assists clients in getting published in the mainstream media. He is the host of TradeSystemGuru.com. Matt has earned the Chartered Market Technician (CMT) designation. Find out what stocks and futures Matt is watching on Twitter at www.twitter.com/RatioTrade
PRINT THIS ARTICLE
CUP WITH HANDLE
Facebook Now Looks Promising
01/23/13 08:19:41 AMby Matt Blackman
By all accounts, the Facebook initial public offering was a poor showing. But now that the bloodletting appears to be over, can this stock join the ranks of Internet high-fliers?
Position: Buy
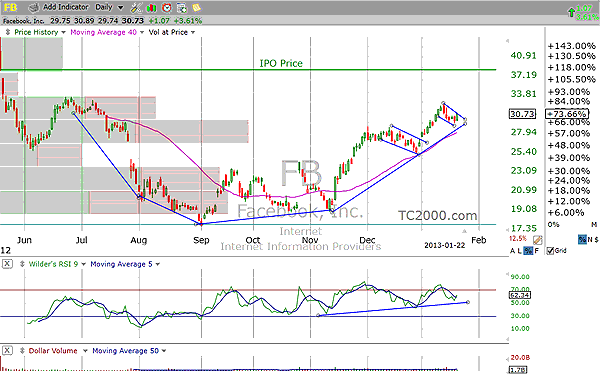
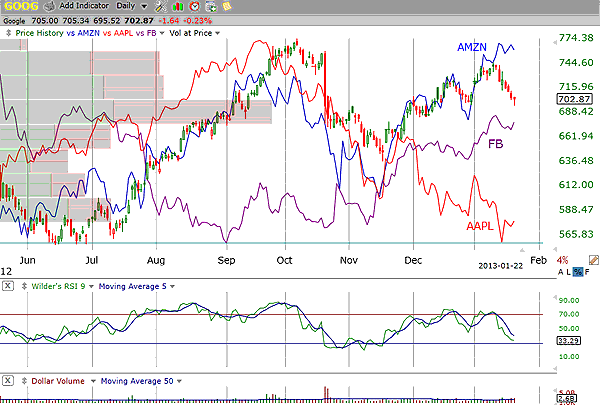
| When it was launched May 18, 2012, the Facebook initial public offering (IPO) experienced a flood of orders. It opened at $38 and almost immediately shot up to $45 before the sellers began to move en masse. By the end of the trading day, most of the gains had evaporated and the stock closed at just $38.25. Dollar volume for the day was $22.2 billion, more than 10 times the average daily volume of the stock in recent days. FB tried to rally a number of times during the summer, but each time the bears won. On July 27, the most brutal bear attack occurred with the stock losing more than 10% of its value in one day. By September 4, the price hit an intraday low of $17.55, a painful 54% drop from its May 18 IPO price. Dollar volume that day was a mere $822.8 million. Clearly, very few who had been trading the stock realized at the time that the worst was over. See Figures 1 and 2. |

|
| FIGURE 1: FACEBOOK, DAILY. This is a chart of Facebook since its IPO in May 2012, showing the cup & handle-like pattern in the process of forming. |
| Graphic provided by: TC2000.com. |
| |
| By the second trading week of January 2013, the picture was looking a lot more positive. After putting in a rather jagged bottom between September and November 2012, FB began a strong rally, posting some bullish flag patterns in the process. And although the pattern looks like a bullish cup & handle pattern, that would be unusual since it does not meet one key C&P criterion -- that the left lip of the cup be at least 30% above its pre-cup low. However, in the case of FB, this point could be moot. Before the IPO, the stock had been held privately at much lower prices, so it could be argued that the 30% lip rule was valid. |
| Next, where should the lip be placed? On the chart, there is one possible lip at $33.50, a second at $38 (IPO price), and a third at the open of $42.05. Given the huge volume on opening day, the band between $38 and $42 represents huge resistance. So does the area between $28 and $32 (see horizontal volume at price bars in Figure 1), albeit on significantly lower volume. So far at least, the second area hasn't been much of a problem for the bulls, but it has provided a good consolidation area witnessed by the two bull flag patterns shown in Figure 1. A breakout from the latest flag above $30.70 on sizable volume is one potential buy point. The next will be a break above the first cup & handle lip above $33.50. Then the $38 to $42 area will present some challenge, as many who bought the IPO in May will undoubtedly be looking to get their money back. |

|
| FIGURE 2: FB, DAILY. Here's a chart of Facebook compared with Google (GOOG), Amazon (AMZN), and Apple (AAPL) since mid-May 2012. |
| Graphic provided by: TC2000.com. |
| |
| This opens the door to the bigger question. What can we expect once the stock gets above IPO resistance, assuming FB is able to mount a successful attack through the $42 area? The answer will depend on a number of factors that have to do with investor and trader anticipation of FB earning power, fundamentally speaking, and how the stock behaves with regards to chart patterns and volume. |
| I'll leave the answer to another time once more data is available. I'm not a fan of the Facebook model for a number of reasons, mostly to do with the amount of time that can be wasted exploring the site and privacy concerns, but it's safe to say that the trading picture for Facebook has changed dramatically from the autumn of 2012. Given the chart patterns now flashing, being short could well be a very painful position to be in over the next few weeks and even months. |
Matt Blackman is a full-time technical and financial writer and trader. He produces corporate and financial newsletters, and assists clients in getting published in the mainstream media. He is the host of TradeSystemGuru.com. Matt has earned the Chartered Market Technician (CMT) designation. Find out what stocks and futures Matt is watching on Twitter at www.twitter.com/RatioTrade
| Company: | TradeSystemGuru.com |
| Address: | Box 2589 |
| Garibaldi Highlands, BC Canada | |
| Phone # for sales: | 604-898-9069 |
| Fax: | 604-898-9069 |
| Website: | www.tradesystemguru.com |
| E-mail address: | indextradermb@gmail.com |
Traders' Resource Links | |
| TradeSystemGuru.com has not added any product or service information to TRADERS' RESOURCE. | |
Click here for more information about our publications!
PRINT THIS ARTICLE

|

Request Information From Our Sponsors
- StockCharts.com, Inc.
- Candle Patterns
- Candlestick Charting Explained
- Intermarket Technical Analysis
- John Murphy on Chart Analysis
- John Murphy's Chart Pattern Recognition
- John Murphy's Market Message
- MurphyExplainsMarketAnalysis-Intermarket Analysis
- MurphyExplainsMarketAnalysis-Visual Analysis
- StockCharts.com
- Technical Analysis of the Financial Markets
- The Visual Investor
- VectorVest, Inc.
- Executive Premier Workshop
- One-Day Options Course
- OptionsPro
- Retirement Income Workshop
- Sure-Fire Trading Systems (VectorVest, Inc.)
- Trading as a Business Workshop
- VectorVest 7 EOD
- VectorVest 7 RealTime/IntraDay
- VectorVest AutoTester
- VectorVest Educational Services
- VectorVest OnLine
- VectorVest Options Analyzer
- VectorVest ProGraphics v6.0
- VectorVest ProTrader 7
- VectorVest RealTime Derby Tool
- VectorVest Simulator
- VectorVest Variator
- VectorVest Watchdog
