HOT TOPICS LIST
- MACD
- Fibonacci
- RSI
- Gann
- ADXR
- Stochastics
- Volume
- Triangles
- Futures
- Cycles
- Volatility
- ZIGZAG
- MESA
- Retracement
- Aroon
INDICATORS LIST
LIST OF TOPICS
PRINT THIS ARTICLE
by Koos van der Merwe
When a program algorithm gives you a buy signal, you must look at it closely.
Position: Buy
Koos van der Merwe
Has been a technical analyst since 1969, and has worked as a futures and options trader with First Financial Futures in Johannesburg, South Africa.
PRINT THIS ARTICLE
ELLIOTT WAVE
Anheuser Busch InBev
01/22/13 07:56:20 AMby Koos van der Merwe
When a program algorithm gives you a buy signal, you must look at it closely.
Position: Buy
| Using a program that automatically gives you buy or sell signals when you run it can save a great deal of time. However, when a buy signal is received, it should always be investigated more closely. |

|
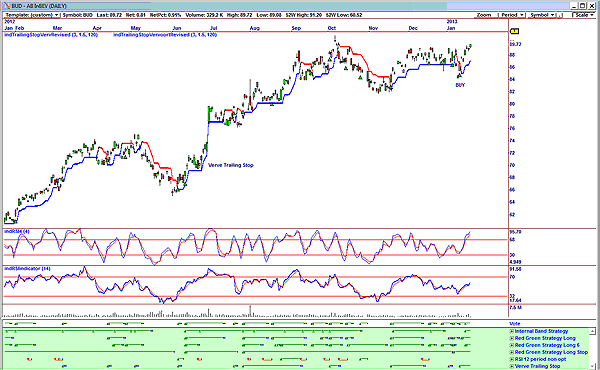
| FIGURE 1: BUD, DAILY. Here's a chart showing buy signals given. |
| Graphic provided by: Omnitrader.. |
| |
| Figure 1 of Anheuser Busch (BUD) shows the various strategies I am using to trigger a buy signal. As you can see, all the strategies, with the exception of the relative strength index (RSI) 12-period strategy, are in buy mode. The Verve trailing stop is used to take us out of the position when the price breaks below it. As you can see, the buy signals given have been accurate. Had you followed the RSI (14-period) shown on the chart, we would have sold out much too early in most instances. Is the share worth a buy, and what would its target be? |

|
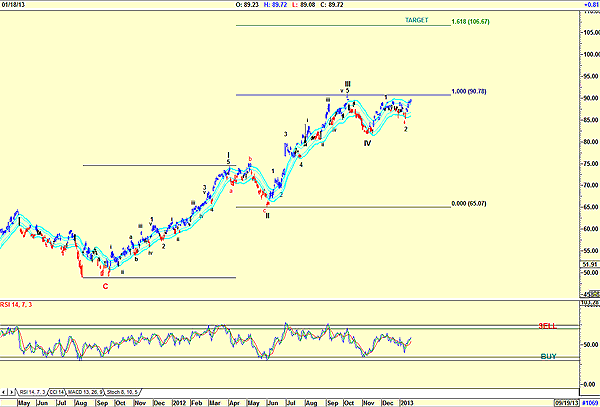
| FIGURE 2: BUD, DAILY. Here's a chart showing an Elliott wave count. |
| Graphic provided by: AdvancedGET. |
| |
| Figure 2 is an Elliott wave count of the share price movement. The count is suggesting that the share is in a wave 3 of wave V, with a target of $106.67. The target is calculated using a Fibonacci extension of wave I, as shown on the chart. The length of wave III is equal to that of wave I. The target is a Fibonacci reading of 1.618 of wave III. I would be a buyer of BUD on a pullback, with a long-term hold until the strategy used in Figure 1 gives me a sell signal. Playing the share using the chart until the price reaches the target of $106.67 can be very profitable for short-term traders paying a low commission. Long-term investors could hold the share until the target is reached, or the RSI moves into overbought levels. |
Has been a technical analyst since 1969, and has worked as a futures and options trader with First Financial Futures in Johannesburg, South Africa.
| Address: | 3256 West 24th Ave |
| Vancouver, BC | |
| Phone # for sales: | 6042634214 |
| E-mail address: | petroosp@gmail.com |
Click here for more information about our publications!
PRINT THIS ARTICLE

Request Information From Our Sponsors
- VectorVest, Inc.
- Executive Premier Workshop
- One-Day Options Course
- OptionsPro
- Retirement Income Workshop
- Sure-Fire Trading Systems (VectorVest, Inc.)
- Trading as a Business Workshop
- VectorVest 7 EOD
- VectorVest 7 RealTime/IntraDay
- VectorVest AutoTester
- VectorVest Educational Services
- VectorVest OnLine
- VectorVest Options Analyzer
- VectorVest ProGraphics v6.0
- VectorVest ProTrader 7
- VectorVest RealTime Derby Tool
- VectorVest Simulator
- VectorVest Variator
- VectorVest Watchdog
- StockCharts.com, Inc.
- Candle Patterns
- Candlestick Charting Explained
- Intermarket Technical Analysis
- John Murphy on Chart Analysis
- John Murphy's Chart Pattern Recognition
- John Murphy's Market Message
- MurphyExplainsMarketAnalysis-Intermarket Analysis
- MurphyExplainsMarketAnalysis-Visual Analysis
- StockCharts.com
- Technical Analysis of the Financial Markets
- The Visual Investor
