HOT TOPICS LIST
- MACD
- Fibonacci
- RSI
- Gann
- ADXR
- Stochastics
- Volume
- Triangles
- Futures
- Cycles
- Volatility
- ZIGZAG
- MESA
- Retracement
- Aroon
INDICATORS LIST
LIST OF TOPICS
PRINT THIS ARTICLE
by Andrew Hetherington
Volume plays an important role when analyzing a breakout from a chart pattern. Here's a recent example on the chart for J.B. Hunt Transport Services (JBHT).
Position: N/A
Andrew Hetherington
Classic Dow Theorist who trades as a pure technician, using pattern recognition.
PRINT THIS ARTICLE
FALSE MOVES
Which Way Will J.B. Hunt Services Go?
08/01/02 02:54:04 PMby Andrew Hetherington
Volume plays an important role when analyzing a breakout from a chart pattern. Here's a recent example on the chart for J.B. Hunt Transport Services (JBHT).
Position: N/A
| A reader recently e-mailed and suggested that everyone knows the market is headed south. She then asked if I could analyze some equities with upside potential. I present this illustration as a word of caution to always play with the trend. I understand if you have your retirement savings in accounts that forbid you to sell short, so my only suggestion is to stay in cash in these accounts until the trend changes to up. I would prefer the market to be in a long position but unfortunately it is still short. |
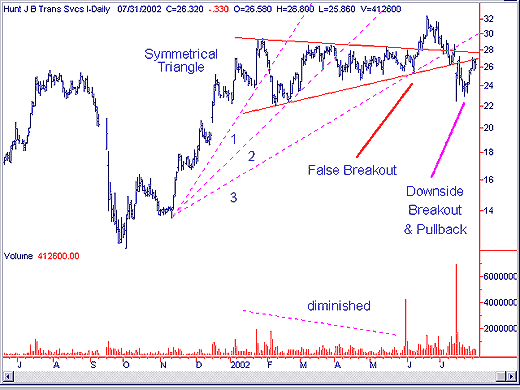
| In Figure 1 you see the daily chart for J.B. Hunt Transport Services (JBHT). This company is part of the Dow Transportation Index. There is a 6-month symmetrical triangle with reasonably good volume on the creation of the pattern. What I mean by reasonable volume is that it generally diminishes throughout the construction of the pattern. There is a spike towards the end of the pattern prior to the breakout but it generally diminishes and is therefore not perfectly diminishing. There is then the false breakout topside without heavy volume. The volume did increase a little in relative terms but it certainly did not spike up the way I prefer my breakouts on the upside. I prefer a gradual increase in volume leading up to the breakout and then 2-4 days of significantly higher volume as the breakout. It's the anticipation of the topside breakouts that is often the key to making a good trade. Following the money trail will generally keep you out of trouble, so it is important to watch for the gradual pick-up in activity prior to the breakout. |

|
| Figure 1: Daily chart for JBHT. |
| Graphic provided by: SuperCharts. |
| |
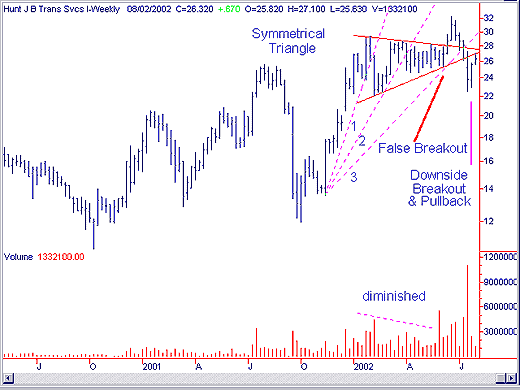
| The third fan line is created just before the topside move and you should then use this line as a stop loss for protection against a false move if you chose to play this equity long. I often call these styles of lines my performance lines. This stop loss from my performance line would have been in the $28.00 area coinciding with the top line of the symmetrical triangle. There is absolutely no doubt that when these lines were broken that someone with a short-term time horizon should go to the sidelines for a small profit or a small loss, or even switch gears and short the equity. This signaled a change in the short-term direction from up to down. Then there are the huge spikes on the downside with a downside breakout. The volume diminishes on the pullback as it should to your current position of $27.00, and the next move is down. |
 Figure 2: Weekly chart for JBHT. These false breakouts occur in strong equities as in this example when the market is working against you. |
Classic Dow Theorist who trades as a pure technician, using pattern recognition.
| Toronto, Canada |
Click here for more information about our publications!
Comments
Date: 08/01/02Rank: 5Comment: Are you aware that the print and part of the graph will not fit onto the screen. I have tried View Test size, Smallest, but the words to the right side of
the article are still off the page.
Thanks for the graph--a good reminder!
B. H. Peterson
Date: 08/07/02Rank: 5Comment:
Date: 08/17/02Rank: 4Comment:

|

Request Information From Our Sponsors
- VectorVest, Inc.
- Executive Premier Workshop
- One-Day Options Course
- OptionsPro
- Retirement Income Workshop
- Sure-Fire Trading Systems (VectorVest, Inc.)
- Trading as a Business Workshop
- VectorVest 7 EOD
- VectorVest 7 RealTime/IntraDay
- VectorVest AutoTester
- VectorVest Educational Services
- VectorVest OnLine
- VectorVest Options Analyzer
- VectorVest ProGraphics v6.0
- VectorVest ProTrader 7
- VectorVest RealTime Derby Tool
- VectorVest Simulator
- VectorVest Variator
- VectorVest Watchdog
- StockCharts.com, Inc.
- Candle Patterns
- Candlestick Charting Explained
- Intermarket Technical Analysis
- John Murphy on Chart Analysis
- John Murphy's Chart Pattern Recognition
- John Murphy's Market Message
- MurphyExplainsMarketAnalysis-Intermarket Analysis
- MurphyExplainsMarketAnalysis-Visual Analysis
- StockCharts.com
- Technical Analysis of the Financial Markets
- The Visual Investor
