HOT TOPICS LIST
- MACD
- Fibonacci
- RSI
- Gann
- ADXR
- Stochastics
- Volume
- Triangles
- Futures
- Cycles
- Volatility
- ZIGZAG
- MESA
- Retracement
- Aroon
INDICATORS LIST
LIST OF TOPICS
PRINT THIS ARTICLE
by Donald W. Pendergast, Jr.
Among financial sector stocks, few are hotter right now than shares of Goldman Sachs, and it appears to be poised for even bigger gains.
Position: N/A
Donald W. Pendergast, Jr.
Freelance financial markets writer and online publisher of the Trendzetterz.com S&P 500 Weekly Forecast service.
PRINT THIS ARTICLE
NEW HIGHS-NEW LOWS
Goldman Sachs And Its New 18-Month High
01/21/13 08:02:34 AMby Donald W. Pendergast, Jr.
Among financial sector stocks, few are hotter right now than shares of Goldman Sachs, and it appears to be poised for even bigger gains.
Position: N/A
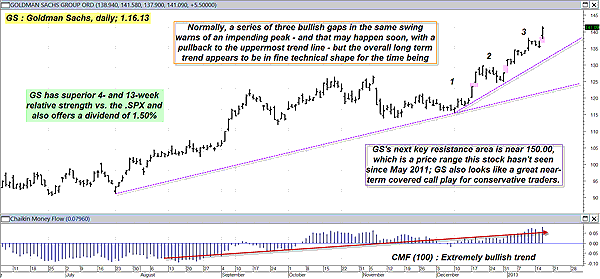
| Having risen by more than 24% in just the last two months, there can be no doubt that shares of Goldman Sachs (GS) are in the midst of a powerful rally, and when you consider that the stock is also up by 57% since late June 2012, it's obvious that several key technical price cycles -- along with attractive long-term fundamentals -- are the true motive power undergirding such a bullish surge. Here's a look at GS's very bullish daily chart (Figure 1), along with a low-risk way to play this trend. |

|
| FIGURE 1: GS, DAILY. The February 2013 GS $135.00 covered call looks to be interesting, especially for conservative traders and investors. |
| Graphic provided by: MetaStock. |
| |
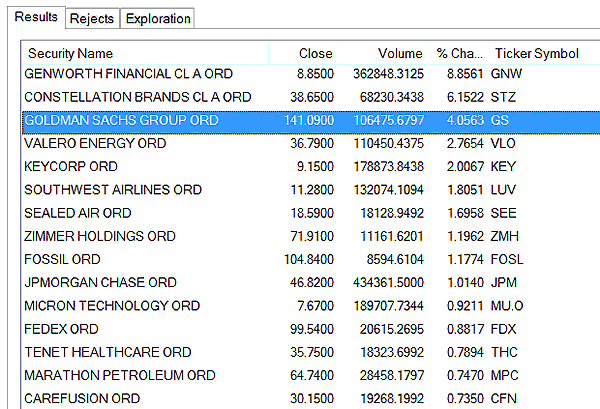
| Aside from the steady uptrend depicted on the chart, the main item of interest to swing traders and covered-call traders is the ultra-bullish 100-period Chaikin money flow (CMF)(100) histogram. It keeps on making new highs along with the stock with no signs of impending divergence with price yet; this is a tipoff that GS might be a very attractive covered-call play over the next month or so. Very few trade setups or chart patterns are picture-perfect, however. One minor area of concern is the three consecutive bullish gaps on the recent upswing, as this could either be an early warning of a near-term pullback to the upper trendline or it could simply be a confirmation that the trend in GS is actually strengthening, with big-money interests still piling in for the time being. Typically, it's when the gaps are more widely separated in terms of time and price that a pattern like this is most accurate at calling an impending top in a market. There are numerous stocks within the .SPX that are manifesting exhaustion gap patterns on their daily charts now, including GS, so if you're the overly cautious type, this might be a good time to go to cash and wait until the market sorts itself out. See Figure 2. |

|
| FIGURE 2: SPX. Stocks from a variety of sectors have been making new highs in the .SPX as of late. |
| Graphic provided by: MetaStock. |
| Graphic provided by: MetaStock Explorer. |
| |
| Right now, a February 2013 GS $135 covered call is going for about $133.58, and with the strong upper trendline as a trailing stop to guide the trade, this looks like one of the smarter covered calls in GS over the next few weeks, as it allows the stock some room to move without having the position stopped out prematurely. The February $135 call has a delta of 0.74 and daily time decay of $5 per contract, and those are also big plusses for this trade setup, as is the fact that GS has very strong four- and 13-week relative strength versus the .SPX. Overall, this is a very conservative trade, one that might work well for a retirement account that can't afford to be too aggressive anymore. As always, limit the risk on every trade to 2% or less and be sure to honor your stop-losses and trading rules. |
Freelance financial markets writer and online publisher of the Trendzetterz.com S&P 500 Weekly Forecast service.
| Title: | Market consultant and writer |
| Company: | Trendzetterz |
| Address: | 81 Hickory Hollow Drive |
| Crossville, TN 38555 | |
| Phone # for sales: | 904-303-4814 |
| Website: | trendzetterz.com |
| E-mail address: | support@trendzetterz.com |
Traders' Resource Links | |
| Trendzetterz has not added any product or service information to TRADERS' RESOURCE. | |
Click here for more information about our publications!
PRINT THIS ARTICLE

Request Information From Our Sponsors
- StockCharts.com, Inc.
- Candle Patterns
- Candlestick Charting Explained
- Intermarket Technical Analysis
- John Murphy on Chart Analysis
- John Murphy's Chart Pattern Recognition
- John Murphy's Market Message
- MurphyExplainsMarketAnalysis-Intermarket Analysis
- MurphyExplainsMarketAnalysis-Visual Analysis
- StockCharts.com
- Technical Analysis of the Financial Markets
- The Visual Investor
- VectorVest, Inc.
- Executive Premier Workshop
- One-Day Options Course
- OptionsPro
- Retirement Income Workshop
- Sure-Fire Trading Systems (VectorVest, Inc.)
- Trading as a Business Workshop
- VectorVest 7 EOD
- VectorVest 7 RealTime/IntraDay
- VectorVest AutoTester
- VectorVest Educational Services
- VectorVest OnLine
- VectorVest Options Analyzer
- VectorVest ProGraphics v6.0
- VectorVest ProTrader 7
- VectorVest RealTime Derby Tool
- VectorVest Simulator
- VectorVest Variator
- VectorVest Watchdog
