HOT TOPICS LIST
- MACD
- Fibonacci
- RSI
- Gann
- ADXR
- Stochastics
- Volume
- Triangles
- Futures
- Cycles
- Volatility
- ZIGZAG
- MESA
- Retracement
- Aroon
INDICATORS LIST
LIST OF TOPICS
PRINT THIS ARTICLE
by Matt Blackman
There has been much ado, primarily fundamentally driven, that the drop in Apple from its September 2012 highs is overdone. Technically speaking, however, here is a case that the correction still has a way to go.
Position: Sell
Matt Blackman
Matt Blackman is a full-time technical and financial writer and trader. He produces corporate and financial newsletters, and assists clients in getting published in the mainstream media. He is the host of TradeSystemGuru.com. Matt has earned the Chartered Market Technician (CMT) designation. Find out what stocks and futures Matt is watching on Twitter at www.twitter.com/RatioTrade
PRINT THIS ARTICLE
HEAD & SHOULDERS
Apple Falling Farther From The Tree?
01/18/13 10:30:58 AMby Matt Blackman
There has been much ado, primarily fundamentally driven, that the drop in Apple from its September 2012 highs is overdone. Technically speaking, however, here is a case that the correction still has a way to go.
Position: Sell
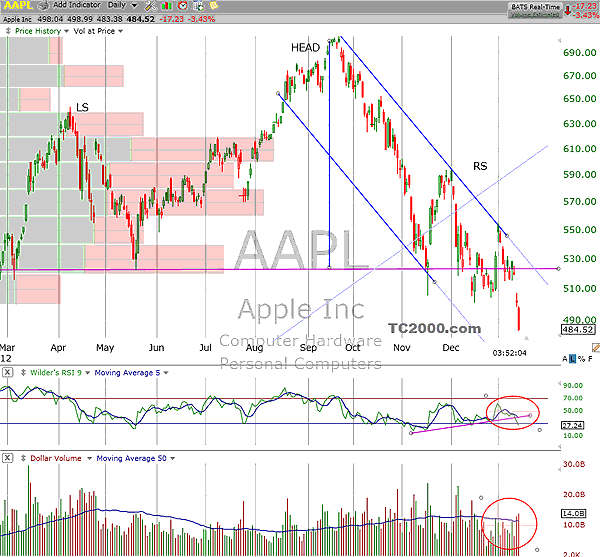
| Anyone who has watched the commentary on Apple Inc. (AAPL) over the last couple of months will have undoubtedly heard analysts discuss the drop in AAPL from its close high of $702.10 on September 19, 2012, and how the move (in the opinion of most) is overdone. After briefly dropping below the neckline of the head & shoulder pattern in December, the stock vacillated just below the neckline resistance. |
| But then in early January, the stock mounted a weak challenge that took the stock back above neckline support before the bears began to move back in. On January 14, the stock suffered a nearly $20 gap down and continued to fall from there, in the process confirming the 11-month-old head & shoulder pattern and in the process breached the relative strength index (RSI) (middle pane), which was accompanied by a spike in selling volume (see lower pane in Figure 1). AAPL has been a spectacular high-flier and has developed a number of passionate believers along the way. But thanks to technical analysis, we are able to strip away most of this emotion from the equation and examine how buyers and sellers have been responding. |

|
| FIGURE 1: AAPL, DAILY. Here's a daily chart of Apple Inc. between March 2012 and January 2013 showing the rough head & shoulder pattern with a messy finish and the stock gapping down below the neckline at $524 (purple line). |
| Graphic provided by: TC2000.com. |
| |
| What the head & shoulders pattern has given us is a concrete minimum downside target for AAPL. By calculating the distance from the September high to the neckline, then taking the same distance from the neckline, we can determine a minimum projected target for AAPL (see Figure 2). Here is the math; $702 (peak) - $524 (neckline) = $178 (difference) $524 - $178 = $346 (minimum projected target) |

|
| FIGURE 2: AAPL, WEEKLY. Here's a weekly chart of Apple Inc. showing the longer-term picture for AAPL with H&S pattern and minimum projected target. |
| Graphic provided by: TC2000.com. |
| |
| As a previous market leader, AAPL was a good prognosticator for future movement in the NASDAQ Composite until late 2012. The question remains whether this stock is anticipating further weakness in technology stocks or if the move will be isolated to Apple stock. |
| If the market strength continues, there is a higher probability that the minimum projected target will not be met and Apple will, at some point, recover and continue higher with other technology stocks. If, however, this is an early indication of further weakness to come, look for AAPL to continue lower toward the mid-$350 range. |
Matt Blackman is a full-time technical and financial writer and trader. He produces corporate and financial newsletters, and assists clients in getting published in the mainstream media. He is the host of TradeSystemGuru.com. Matt has earned the Chartered Market Technician (CMT) designation. Find out what stocks and futures Matt is watching on Twitter at www.twitter.com/RatioTrade
| Company: | TradeSystemGuru.com |
| Address: | Box 2589 |
| Garibaldi Highlands, BC Canada | |
| Phone # for sales: | 604-898-9069 |
| Fax: | 604-898-9069 |
| Website: | www.tradesystemguru.com |
| E-mail address: | indextradermb@gmail.com |
Traders' Resource Links | |
| TradeSystemGuru.com has not added any product or service information to TRADERS' RESOURCE. | |
Click here for more information about our publications!
PRINT THIS ARTICLE

Request Information From Our Sponsors
- StockCharts.com, Inc.
- Candle Patterns
- Candlestick Charting Explained
- Intermarket Technical Analysis
- John Murphy on Chart Analysis
- John Murphy's Chart Pattern Recognition
- John Murphy's Market Message
- MurphyExplainsMarketAnalysis-Intermarket Analysis
- MurphyExplainsMarketAnalysis-Visual Analysis
- StockCharts.com
- Technical Analysis of the Financial Markets
- The Visual Investor
- VectorVest, Inc.
- Executive Premier Workshop
- One-Day Options Course
- OptionsPro
- Retirement Income Workshop
- Sure-Fire Trading Systems (VectorVest, Inc.)
- Trading as a Business Workshop
- VectorVest 7 EOD
- VectorVest 7 RealTime/IntraDay
- VectorVest AutoTester
- VectorVest Educational Services
- VectorVest OnLine
- VectorVest Options Analyzer
- VectorVest ProGraphics v6.0
- VectorVest ProTrader 7
- VectorVest RealTime Derby Tool
- VectorVest Simulator
- VectorVest Variator
- VectorVest Watchdog
