HOT TOPICS LIST
- MACD
- Fibonacci
- RSI
- Gann
- ADXR
- Stochastics
- Volume
- Triangles
- Futures
- Cycles
- Volatility
- ZIGZAG
- MESA
- Retracement
- Aroon
INDICATORS LIST
LIST OF TOPICS
PRINT THIS ARTICLE
by Koos van der Merwe
With the US economy expected to recover in the years ahead, is it time to buy Macy's?
Position: Sell
Koos van der Merwe
Has been a technical analyst since 1969, and has worked as a futures and options trader with First Financial Futures in Johannesburg, South Africa.
PRINT THIS ARTICLE
CYCLES
Does Macy's Lead The Dow?
01/17/13 08:03:37 AMby Koos van der Merwe
With the US economy expected to recover in the years ahead, is it time to buy Macy's?
Position: Sell
| We all know Macy's, the retail store. If you haven't visited the store, even if you just walk through all the floors, looking at the merchandise, enjoying the ambience of one of the US's top retail stores, then you haven't experienced America. The store is famous for its diversity. It has produced the Macy's Thanksgiving Day Parade in New York City annually since 1924, also sponsoring the city's annual Fourth of July fireworks display since 1976. With the US economy expected to recover over the next four years, should we buy the shares now and hold for the long term? Let us look at the charts. |

|
| FIGURE 1: MACY'S, MONTHLY |
| Graphic provided by: AdvancedGET. |
| |
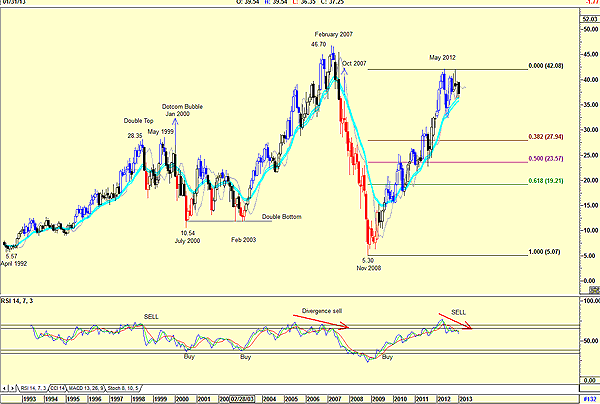
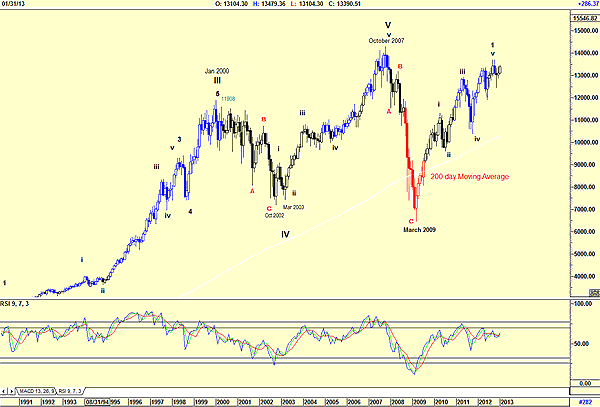
| Figure 1 is a monthly chart of Macy's and shows how the share price fell from $28.35 with the dotcom bubble burst to a low of $10.54 by July 2000. In actual fact, the share price formed a double top at $28.35 and started falling in May 1999 seven months earlier than the bubble burst in 2000 as shown in the chart of the DJIA in Figure 2. I can only assume that this was because investors sold their shares in Macy's to buy dotcom shares. The old story: investors buy at the top and sell at the bottom. Forming a double bottom at $10.54 between July 2000 and February 2003, the share price started to climb reaching a high of $46.70 by February 2007 before falling to a low of $5.30 by November 2008. The DJIA only bottomed in March 2009. Once again, the share price of Macy's acted as a leader in market direction. |

|
| FIGURE 2: DJIA, MONTHLY |
| Graphic provided by: AdvancedGET. |
| |
| Figure 2 is a monthly chart of the DJIA showing the market meltdowns of January 2000 and October 2007. The Elliott wave count leading into a current wave 1 is not a confirmed count and could change should the DJIA's performance change. However, with the monthly chart of Macy's suggesting a sell, as shown by the relative strength index (RSI), a wave 2 correction or an ABC correction of the DJIA could occur. With the history of Macy's share price showing that it leads the DJIA, and with the RSI in Figure 1 suggesting a sell signal for Macy's shares, in May 2012 we could expect the DJIA to follow suit and start falling. Savvy investors could keep this in mind, analyze their portfolios, and start taking profits. |
Has been a technical analyst since 1969, and has worked as a futures and options trader with First Financial Futures in Johannesburg, South Africa.
| Address: | 3256 West 24th Ave |
| Vancouver, BC | |
| Phone # for sales: | 6042634214 |
| E-mail address: | petroosp@gmail.com |
Click here for more information about our publications!
Comments

Request Information From Our Sponsors
- VectorVest, Inc.
- Executive Premier Workshop
- One-Day Options Course
- OptionsPro
- Retirement Income Workshop
- Sure-Fire Trading Systems (VectorVest, Inc.)
- Trading as a Business Workshop
- VectorVest 7 EOD
- VectorVest 7 RealTime/IntraDay
- VectorVest AutoTester
- VectorVest Educational Services
- VectorVest OnLine
- VectorVest Options Analyzer
- VectorVest ProGraphics v6.0
- VectorVest ProTrader 7
- VectorVest RealTime Derby Tool
- VectorVest Simulator
- VectorVest Variator
- VectorVest Watchdog
- StockCharts.com, Inc.
- Candle Patterns
- Candlestick Charting Explained
- Intermarket Technical Analysis
- John Murphy on Chart Analysis
- John Murphy's Chart Pattern Recognition
- John Murphy's Market Message
- MurphyExplainsMarketAnalysis-Intermarket Analysis
- MurphyExplainsMarketAnalysis-Visual Analysis
- StockCharts.com
- Technical Analysis of the Financial Markets
- The Visual Investor
