HOT TOPICS LIST
- MACD
- Fibonacci
- RSI
- Gann
- ADXR
- Stochastics
- Volume
- Triangles
- Futures
- Cycles
- Volatility
- ZIGZAG
- MESA
- Retracement
- Aroon
INDICATORS LIST
LIST OF TOPICS
PRINT THIS ARTICLE
by Gary Grosschadl
More technical traders pay attention to the volatility index these days, hoping for a lasting turn in the market from bearish to bullish.
Position: N/A
Gary Grosschadl
Independent Canadian equities trader and technical analyst based in Peterborough
Ontario, Canada.
PRINT THIS ARTICLE
TECHNICAL INDICATORS
VIX Watchers Should Not Get Overconfident
07/30/02 09:30:40 AMby Gary Grosschadl
More technical traders pay attention to the volatility index these days, hoping for a lasting turn in the market from bearish to bullish.
Position: N/A
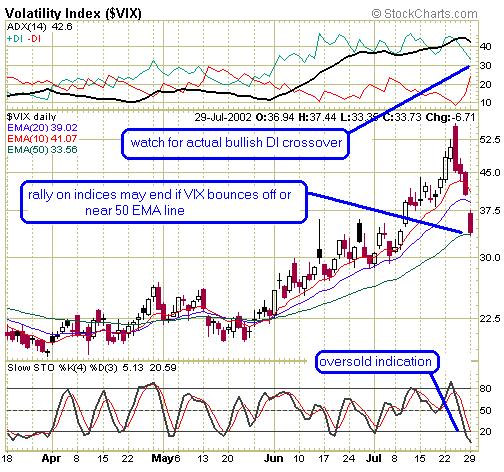
| Now that the VIX has finally spiked into very high levels levels (above 50 and well above 37.5 minimum), a rally is upon us as the VIX backs off to lower levels. Recall that the Chicago Board Options Exchange Volatility Index is used by stock and options traders to monitor the market's anxiety level. It is a mathematical measure of how much the market thinks the S&P 100 index option (OEX) will fluctuate over the next 12 months based on the difference between put and call options. For contrarians, low readings for the VIX are bearish, while high readings are bullish. My previous observations show that the Nasdaq has great correlation to VIX. To determine if this will be a lasting rally, several confirmations are required: 1. Nasdaq should close above its 20-day EMA. 2. Directional movement indicator shows bullish DI crossover. 3. Multiple closes above the 50-day EMA. 4. 10- and 20-day EMA crossovers of the 50-day EMA line as final confirmation. Currently, as a good first step, the Nasdaq is on the verge of beating 20-day EMA resistance at 1347. |
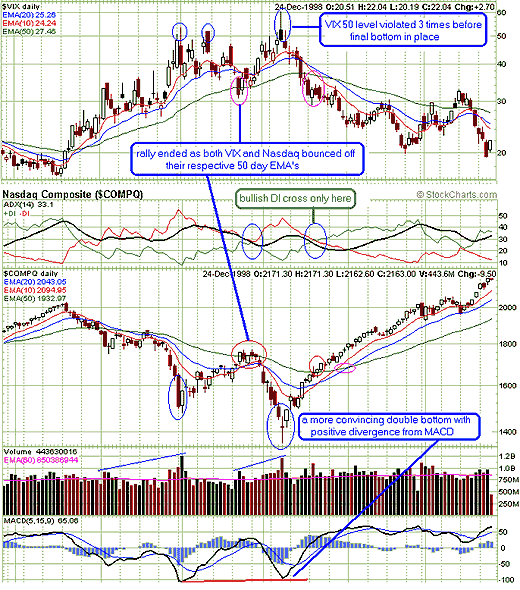
| The first chart shows an interesting example from 1998 when VIX levels peaked several times before a more convincing bottom was in place. The second chart shows the current VIX. This example illustrates the further confirmations needed in order to avoid a similar bearish movement which might induce a repeat of the 1998 double bottom. |

|
| Figure 1: 1998 comparison |
| Graphic provided by: StockCharts.com. |
| |
 Figure 2: Current VIX. Enjoy the rally but beware any reversals. The bear is frightened but it is too soon to say vanquished. |
Independent Canadian equities trader and technical analyst based in Peterborough
Ontario, Canada.
| Website: | www.whatsonsale.ca/financial.html |
| E-mail address: | gwg7@sympatico.ca |
Click here for more information about our publications!
Comments
Date: 07/30/02Rank: 5Comment:
Date: 07/30/02Rank: 5Comment:
Date: 08/01/02Rank: 5Comment: Great, thanks.
I am puzzled as to colors used for
EMA s. To be the green should be the 10 day since this signifies a buy, Red or Pink for 50 day as an Alert. Mmmmmn.
The four criteria for lasting rally interesting confirmation.
Thanks, B. H. Peterson
Date: 08/06/02Rank: 5Comment:
Date: 08/08/02Rank: 5Comment: VERY GOOD PRESENTATION!!

Request Information From Our Sponsors
- StockCharts.com, Inc.
- Candle Patterns
- Candlestick Charting Explained
- Intermarket Technical Analysis
- John Murphy on Chart Analysis
- John Murphy's Chart Pattern Recognition
- John Murphy's Market Message
- MurphyExplainsMarketAnalysis-Intermarket Analysis
- MurphyExplainsMarketAnalysis-Visual Analysis
- StockCharts.com
- Technical Analysis of the Financial Markets
- The Visual Investor
- VectorVest, Inc.
- Executive Premier Workshop
- One-Day Options Course
- OptionsPro
- Retirement Income Workshop
- Sure-Fire Trading Systems (VectorVest, Inc.)
- Trading as a Business Workshop
- VectorVest 7 EOD
- VectorVest 7 RealTime/IntraDay
- VectorVest AutoTester
- VectorVest Educational Services
- VectorVest OnLine
- VectorVest Options Analyzer
- VectorVest ProGraphics v6.0
- VectorVest ProTrader 7
- VectorVest RealTime Derby Tool
- VectorVest Simulator
- VectorVest Variator
- VectorVest Watchdog
