HOT TOPICS LIST
- MACD
- Fibonacci
- RSI
- Gann
- ADXR
- Stochastics
- Volume
- Triangles
- Futures
- Cycles
- Volatility
- ZIGZAG
- MESA
- Retracement
- Aroon
INDICATORS LIST
LIST OF TOPICS
PRINT THIS ARTICLE
by Donald W. Pendergast, Jr.
Shares of Visa International are up by more than 110% in the past 28 months, but signs of distribution are clearly evident.
Position: N/A
Donald W. Pendergast, Jr.
Freelance financial markets writer and online publisher of the Trendzetterz.com S&P 500 Weekly Forecast service.
PRINT THIS ARTICLE
CYCLES
Visa International Near-Term Peak Approaches
01/16/13 10:33:50 AMby Donald W. Pendergast, Jr.
Shares of Visa International are up by more than 110% in the past 28 months, but signs of distribution are clearly evident.
Position: N/A
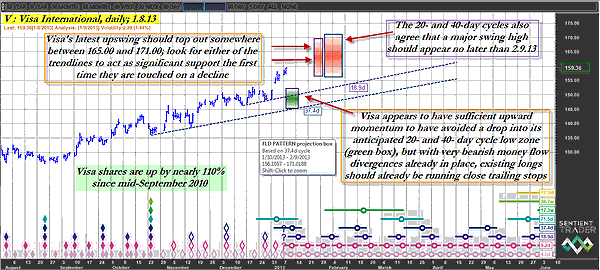
| Of all the stocks in the .OEX, one of the most consistently trending stocks has been Visa International (V); this financial sector giant's share price is up nearly 290% since making a major low back in January 2009 (a full two months before the rest of the broad markets finally hit rock bottom) and has more than doubled since its subsequent pullback cycle low in September 2010. As anyone who's traded stocks for a while knows, it's rare to see such a heavily traded large-cap issue turn in such remarkable percentage gains, and at the moment, traders and investors seem hellbent on milking V's uptrend for every bit that it's worth. And that's the reason for this article -- to alert savvy traders and investors that a decline of some degree (its exact depth and duration unknown, as always) is very likely to come out of nowhere in the next few weeks in this stock -- not unlike the sudden decline that took hold in shares of Apple Inc. (AAPL) last September. Here's a closer look now (see Figures 1 and 2). |

|
| FIGURE 1: V, DAILY. Is the four-year uptrend in shares of Visa International finally getting close to an end? No one knows, but the technicals strongly suggest some sort of a pullback or trend reversal is likely soon. |
| Graphic provided by: Sentient Trader. |
| |
| We'll really need to examine only two major pieces of technical evidence to conclude that V is setting up for a proportional pullback -- if not a full-blown trend reversal -- within the next two to four weeks. The first one is the highly reliable Chaikin money flow histogram [(CMF)(100)], and it is clearly depicting a major bearish divergence with price, making lower highs even as V continues to grind higher. Price/indicator divergences like this are usually very reliable warnings that the smart money interests in the market have been unloading ever-increasing portions of their holdings in a given stock, with the shares typically being scooped up by less sophisticated latecomers to the rally -- and after a four-year long rally, when the trend decides it wants to reverse lower to correct all of its internal speculative excess, the resulting plunge can be fast, furious, and downright frightening. |

|
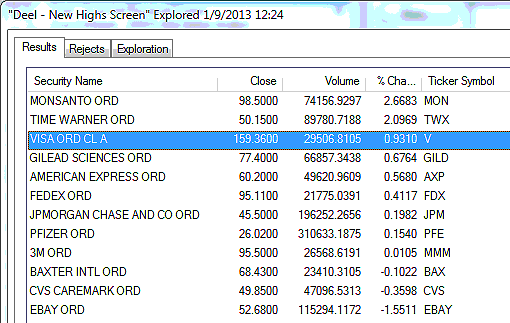
| FIGURE 2: OEX. Note the diverse group of .OEX stocks making new highs on Tuesday, January 8, 2013. |
| Graphic provided by: MetaStock. |
| Graphic provided by: MetaStock Explorer. |
| |
| The second bit of technical evidence is the agreement of V's 20- and 40- day price cycles that a significant swing high (red boxes on chart) is due sometime between January 25 and February 9, 2013, with an anticipated maximum price target of 171.25. One fascinating technical dynamic on this chart is that V appears to have completely forgotten to pull back down into (or at least toward) its anticipated 20/40-day cycle low target (green box); the stock's upward momentum is still very powerful, obviously, but as the money flow divergence begins to play out, momentum will eventually wane, setting the stock up for an even larger degree decline. The twin trendlines on the chart are two areas to expect a noticeable technical bounce during the anticipated decline, so be aware that the bulls in this stock aren't going to walk away from a four-year rally without a good fight. Given that likelihood, it might pay for speculative traders to buy slightly in-the-money puts with two to three months' time value, looking to cash in on major breaks of intraday support once it becomes clear that a major swing high is finally in place. Existing medium-term longs in V should already be preparing a protective put and/or exit strategy now before waiting for a massive one-day reversal bar to potentially wipe out weeks, if not months, of accumulated open profits. And any final surge up into the red cycle high zones should be a de facto signal for those wishing to avoid such stock market unpleasantness. Trade wisely and always try to prepare for the unexpected, no matter what kind of stock or trading style you deal in, and remember to keep the risk to your trading capital at no more than 1% to 2% per trade. |
Freelance financial markets writer and online publisher of the Trendzetterz.com S&P 500 Weekly Forecast service.
| Title: | Market consultant and writer |
| Company: | Trendzetterz |
| Address: | 81 Hickory Hollow Drive |
| Crossville, TN 38555 | |
| Phone # for sales: | 904-303-4814 |
| Website: | trendzetterz.com |
| E-mail address: | support@trendzetterz.com |
Traders' Resource Links | |
| Trendzetterz has not added any product or service information to TRADERS' RESOURCE. | |
Click here for more information about our publications!
PRINT THIS ARTICLE

Request Information From Our Sponsors
- VectorVest, Inc.
- Executive Premier Workshop
- One-Day Options Course
- OptionsPro
- Retirement Income Workshop
- Sure-Fire Trading Systems (VectorVest, Inc.)
- Trading as a Business Workshop
- VectorVest 7 EOD
- VectorVest 7 RealTime/IntraDay
- VectorVest AutoTester
- VectorVest Educational Services
- VectorVest OnLine
- VectorVest Options Analyzer
- VectorVest ProGraphics v6.0
- VectorVest ProTrader 7
- VectorVest RealTime Derby Tool
- VectorVest Simulator
- VectorVest Variator
- VectorVest Watchdog
- StockCharts.com, Inc.
- Candle Patterns
- Candlestick Charting Explained
- Intermarket Technical Analysis
- John Murphy on Chart Analysis
- John Murphy's Chart Pattern Recognition
- John Murphy's Market Message
- MurphyExplainsMarketAnalysis-Intermarket Analysis
- MurphyExplainsMarketAnalysis-Visual Analysis
- StockCharts.com
- Technical Analysis of the Financial Markets
- The Visual Investor
