HOT TOPICS LIST
- MACD
- Fibonacci
- RSI
- Gann
- ADXR
- Stochastics
- Volume
- Triangles
- Futures
- Cycles
- Volatility
- ZIGZAG
- MESA
- Retracement
- Aroon
INDICATORS LIST
LIST OF TOPICS
PRINT THIS ARTICLE
by Koos van der Merwe
In 1985 I was told by a fundamental gold analyst that there is more gold out of the ground than in the ground throughout the world. What does this mean for gold investments?
Position: Sell
Koos van der Merwe
Has been a technical analyst since 1969, and has worked as a futures and options trader with First Financial Futures in Johannesburg, South Africa.
PRINT THIS ARTICLE
ELLIOTT WAVE
A Look At Gold
01/15/13 08:09:37 AMby Koos van der Merwe
In 1985 I was told by a fundamental gold analyst that there is more gold out of the ground than in the ground throughout the world. What does this mean for gold investments?
Position: Sell
| The United States Bullion Depository -- known as Fort Knox -- holds 4.578 metric tons of gold bullion, which is roughly 3% of all the gold ever refined throughout human history, yet it is second in the USA to the Federal Reserve Bank of New York's vault in Manhattan, which holds 7,000 metric tons of gold bullion, some in trust for foreign nations, central banks, and official international organizations. Germany is the next leading country holding enormous gold reserves. Why? When the value of a currency was tied to gold ($35 per ounce), then we could understand why. In today's uncertain world, investors buy gold as a hedge against economic, political, or social currency crises, including investment market declines, burgeoning national debt, currency failure , inflation, war and social unrest. With the burgeoning national debt of the US and the political conflict between the Republican-controlled Congress and President Barack Obama, many investors are staying in cash, or buying gold as a hedge. What do our charts tell us about the future for gold? |

|
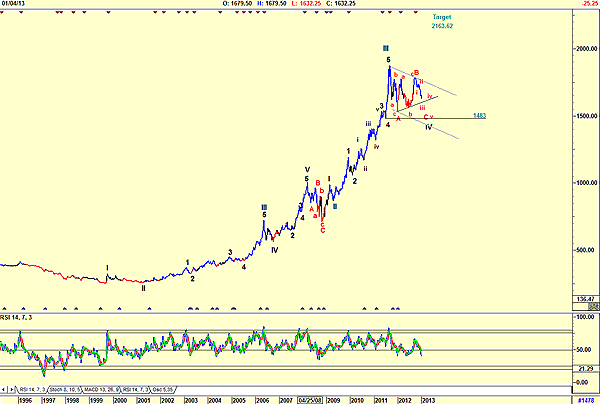
| FIGURE 1: LONDON GOLD, WEEKLY |
| Graphic provided by: AdvancedGET. |
| |
| Figure 1 is a weekly chart of the London gold price. My Elliott wave count suggests that the London gold price is in a wave IV correction with a wave V target of 2163.62. The chart does follow the first rule of Elliott wave analysis -- "It looks right" -- and with the relative strength index (RSI) falling, showing further weakness ahead, the wave IV target of 1483 looks very real. I have also drawn in a trendline suggesting a bullish triangular formation developing, but the Elliott wave count cannot verify this formation, preferring the flag pattern shown for the wave IV correction. |

|
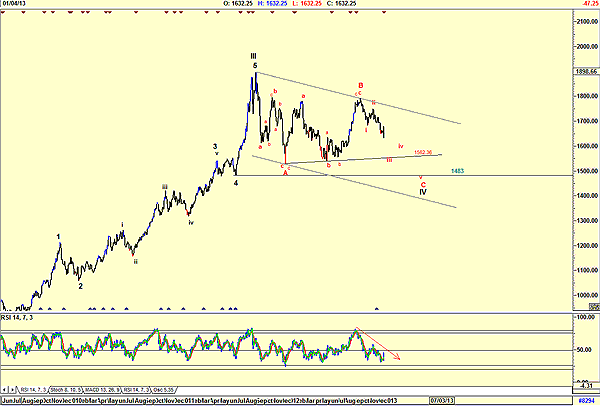
| FIGURE 2: LONDON GOLD, DAILY |
| Graphic provided by: AdvancedGET. |
| |
| The daily chart in Figure 2 shows the wave IV count a great deal clearer. Wave IV counts the bottom within the fourth wave of lesser degree, the low of which is 1483. The falling RSI suggests that this is indeed possible. However, with the triangular pattern looking possible, the correction being an abc correction rather than the 1-2-3-4-5 correction that is normal for a C-wave, the target of 1562.36 could be an outside possibility. When I look at the two charts, I must go with the "wave must look correct" pattern, suggesting a fall in the gold price to 1483. However, with the political uncertainty between Congress and the US President a negative overhang to the stock market, gold could rise as investors hedge their portfolios. |
Has been a technical analyst since 1969, and has worked as a futures and options trader with First Financial Futures in Johannesburg, South Africa.
| Address: | 3256 West 24th Ave |
| Vancouver, BC | |
| Phone # for sales: | 6042634214 |
| E-mail address: | petroosp@gmail.com |
Click here for more information about our publications!
PRINT THIS ARTICLE

|

Request Information From Our Sponsors
- StockCharts.com, Inc.
- Candle Patterns
- Candlestick Charting Explained
- Intermarket Technical Analysis
- John Murphy on Chart Analysis
- John Murphy's Chart Pattern Recognition
- John Murphy's Market Message
- MurphyExplainsMarketAnalysis-Intermarket Analysis
- MurphyExplainsMarketAnalysis-Visual Analysis
- StockCharts.com
- Technical Analysis of the Financial Markets
- The Visual Investor
- VectorVest, Inc.
- Executive Premier Workshop
- One-Day Options Course
- OptionsPro
- Retirement Income Workshop
- Sure-Fire Trading Systems (VectorVest, Inc.)
- Trading as a Business Workshop
- VectorVest 7 EOD
- VectorVest 7 RealTime/IntraDay
- VectorVest AutoTester
- VectorVest Educational Services
- VectorVest OnLine
- VectorVest Options Analyzer
- VectorVest ProGraphics v6.0
- VectorVest ProTrader 7
- VectorVest RealTime Derby Tool
- VectorVest Simulator
- VectorVest Variator
- VectorVest Watchdog
