HOT TOPICS LIST
- MACD
- Fibonacci
- RSI
- Gann
- ADXR
- Stochastics
- Volume
- Triangles
- Futures
- Cycles
- Volatility
- ZIGZAG
- MESA
- Retracement
- Aroon
INDICATORS LIST
LIST OF TOPICS
PRINT THIS ARTICLE
by Koos van der Merwe
Action around the Consumer Electronics Show got under way on January 7, with a preshow press event for Qualcomm Inc.
Position: Buy
Koos van der Merwe
Has been a technical analyst since 1969, and has worked as a futures and options trader with First Financial Futures in Johannesburg, South Africa.
PRINT THIS ARTICLE
STRATEGIES
Looking At Qualcomm
01/10/13 07:55:23 AMby Koos van der Merwe
Action around the Consumer Electronics Show got under way on January 7, with a preshow press event for Qualcomm Inc.
Position: Buy
| Qualcomm CEO Paul Jacobs delivered the opening address on Monday night, a slot traditionally held by Microsoft CEO Steve Ballmer. Qualcomm announced new products for its line of modems and application processors used in smartphones and tablets. |

|
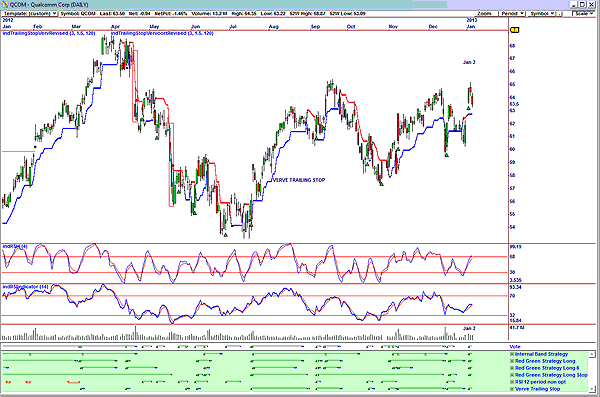
| FIGURE 1: QCOM, DAILY. This chart shows a buy. |
| Graphic provided by: OmniTrader. |
| |
| In Figure 1, a daily chart of Qualcomm, the vote line has given a buy signal on January 2, 2013. The share price rose strongly to $64.75 but then fell over the next two days to its present low of $63.50. |

|
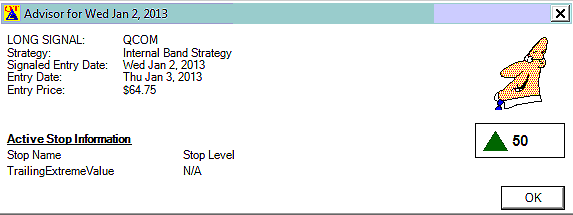
| FIGURE 2: QCOM ADVISOR RATING |
| Graphic provided by: OmniTrader. |
| |
| The advisor rating shown in Figure 2 is 50, with an entry price at $64.75 on Thursday, January 3, 2013. The strategy that triggered the buy signal was the internal band strategy. However, a look at all the strategies below the vote line shows that all the strategies with the exception of the relative strength index (RSI) 12-period gave buy signals. |

|
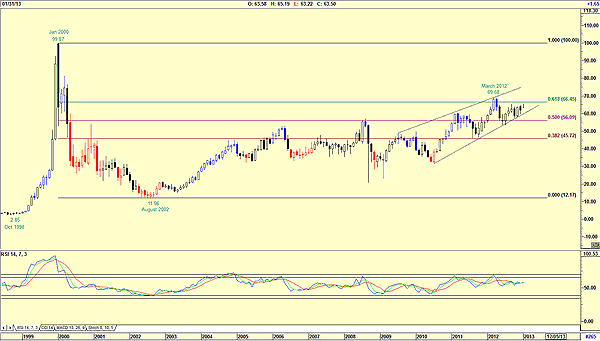
| FIGURE 3: QCOM, MONTHLY |
| Graphic provided by: AdvancedGET. |
| |
| Figure 3, a monthly chart, shows how the price rose from $2.85 in October 1998 to a high of $99.87 by January 2002. With the bursting of the bubble, the share price dropped to $11.96 by August 2002. Since then, the price has risen steadily to a high of $69.58 by March 2012 in what could be a rising wedge. Note how the price traded between the 61.8% and 50% Fibonacci levels since March 2012. The RSI is suggesting future weakness. However, should the price rise above the $69.58 pivot point, the price could rise higher. The charts are suggesting that for the short term, Qualcomm is a buy, but the monthly chart is suggesting long-term weakness. |
Has been a technical analyst since 1969, and has worked as a futures and options trader with First Financial Futures in Johannesburg, South Africa.
| Address: | 3256 West 24th Ave |
| Vancouver, BC | |
| Phone # for sales: | 6042634214 |
| E-mail address: | petroosp@gmail.com |
Click here for more information about our publications!
PRINT THIS ARTICLE

Request Information From Our Sponsors
- StockCharts.com, Inc.
- Candle Patterns
- Candlestick Charting Explained
- Intermarket Technical Analysis
- John Murphy on Chart Analysis
- John Murphy's Chart Pattern Recognition
- John Murphy's Market Message
- MurphyExplainsMarketAnalysis-Intermarket Analysis
- MurphyExplainsMarketAnalysis-Visual Analysis
- StockCharts.com
- Technical Analysis of the Financial Markets
- The Visual Investor
- VectorVest, Inc.
- Executive Premier Workshop
- One-Day Options Course
- OptionsPro
- Retirement Income Workshop
- Sure-Fire Trading Systems (VectorVest, Inc.)
- Trading as a Business Workshop
- VectorVest 7 EOD
- VectorVest 7 RealTime/IntraDay
- VectorVest AutoTester
- VectorVest Educational Services
- VectorVest OnLine
- VectorVest Options Analyzer
- VectorVest ProGraphics v6.0
- VectorVest ProTrader 7
- VectorVest RealTime Derby Tool
- VectorVest Simulator
- VectorVest Variator
- VectorVest Watchdog
