HOT TOPICS LIST
- MACD
- Fibonacci
- RSI
- Gann
- ADXR
- Stochastics
- Volume
- Triangles
- Futures
- Cycles
- Volatility
- ZIGZAG
- MESA
- Retracement
- Aroon
INDICATORS LIST
LIST OF TOPICS
PRINT THIS ARTICLE
by Chaitali Mohile
Can the Utilities Select Sector SPDR gather the strength to regain the bullish rally?
Position: N/A
Chaitali Mohile
Active trader in the Indian stock markets since 2003 and a full-time writer. Trading is largely based upon technical analysis.
PRINT THIS ARTICLE
BREAKOUTS
XLU Under Strong Resistance Pressure
01/07/13 01:19:44 PMby Chaitali Mohile
Can the Utilities Select Sector SPDR gather the strength to regain the bullish rally?
Position: N/A
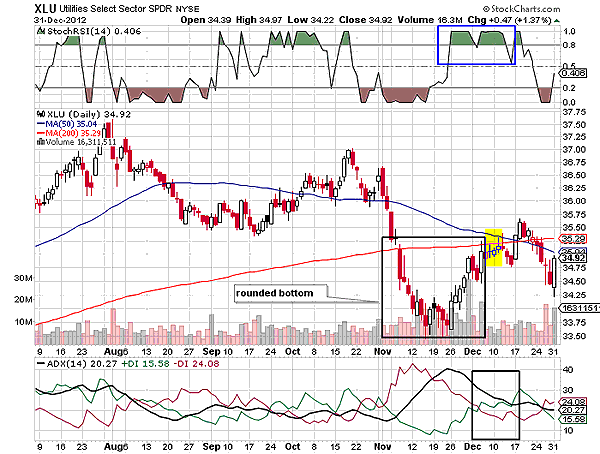
| In the past few months, the Utilities Select Sector SPDR (XLU) has been facing huge bearish pressure. The volatile downward rally plunged below the 50-day moving average (MA) as well as the 200-day (MA) support in Figure 1. The descending price action developed a short-term fresh bearish trend. The selling force increased as the stock slipped below its long-term MA support. But an overheated downtrend indicated by the average directional index (ADX) (14) showed a reversal possibility for XLU. The stochRSI (14) was unable to sustain in an oversold region. Due to these reversal signs, the sector index formed a bottom below the 200-day MA resistance. A rounded bottom in Figure 1 (see the big block) reflected a bullish reversal formation for XLU. |

|
| FIGURE 1: XLU, DAILY |
| Graphic provided by: StockCharts.com. |
| |
| However, the reversal pattern failed to breach the moving average resistance. The price rally moved sideways, forming a cluster of doji candlesticks. The converged 50-day MA and 200-day MA restricted the breakout rally, plunging XLU once again in the bearish zone of the price chart. The ADX (14) could not develop in either direction. The trend turned weaker, inducing a huge volatility in the rally. The overbought stochRSI (14) slipped vertically in an oversold region. Thus, the bearish pressure on XLU is increasing. |

|
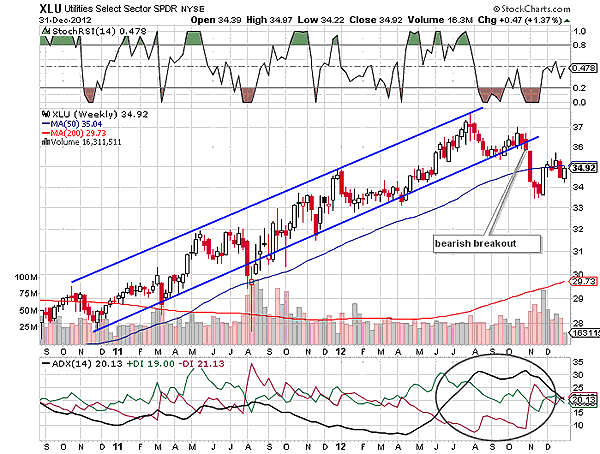
| FIGURE 2: XLU, WEEKLY |
| Graphic provided by: StockCharts.com. |
| |
| The entire ascending rally of XLU in Figure 2 occurred on a very weak trend. The sector index traveled from 28 to 37 levels in an ascending channel. Due to the weak trend, the stock took almost two years to cover the small distance of nine points. The ADX (14) moved in a developed uptrend region as the index hit the top. However, the unstable stochRSI plunged from an overbought region. As a result, the ascending channel underwent a bearish breakout, indicating a major bearish event for XLU. The flooding buying and selling pressure is likely to add up the volatility near the 50-day MA resistance. |
| Although the other oscillator has surged from the oversold zone, it is reluctant to climb the center line (Figure 2). The bearish breakout of the ascending channel would strengthen the selling pressure. In this scenario, converting the 50-day MA resistance to support would be very difficult. |
| Currently, XLU is under bearish pressure; therefore, regaining bullish levels would be very challenging. The short-term MA and lower trendline of the ascending channel in Figure 2 are the two major resistance lines observed for XLU. |
Active trader in the Indian stock markets since 2003 and a full-time writer. Trading is largely based upon technical analysis.
| Company: | Independent |
| Address: | C1/3 Parth Indraprasth Towers. Vastrapur |
| Ahmedabad, Guj 380015 | |
| E-mail address: | chaitalimohile@yahoo.co.in |
Traders' Resource Links | |
| Independent has not added any product or service information to TRADERS' RESOURCE. | |
Click here for more information about our publications!
PRINT THIS ARTICLE

Request Information From Our Sponsors
- StockCharts.com, Inc.
- Candle Patterns
- Candlestick Charting Explained
- Intermarket Technical Analysis
- John Murphy on Chart Analysis
- John Murphy's Chart Pattern Recognition
- John Murphy's Market Message
- MurphyExplainsMarketAnalysis-Intermarket Analysis
- MurphyExplainsMarketAnalysis-Visual Analysis
- StockCharts.com
- Technical Analysis of the Financial Markets
- The Visual Investor
- VectorVest, Inc.
- Executive Premier Workshop
- One-Day Options Course
- OptionsPro
- Retirement Income Workshop
- Sure-Fire Trading Systems (VectorVest, Inc.)
- Trading as a Business Workshop
- VectorVest 7 EOD
- VectorVest 7 RealTime/IntraDay
- VectorVest AutoTester
- VectorVest Educational Services
- VectorVest OnLine
- VectorVest Options Analyzer
- VectorVest ProGraphics v6.0
- VectorVest ProTrader 7
- VectorVest RealTime Derby Tool
- VectorVest Simulator
- VectorVest Variator
- VectorVest Watchdog
