HOT TOPICS LIST
- MACD
- Fibonacci
- RSI
- Gann
- ADXR
- Stochastics
- Volume
- Triangles
- Futures
- Cycles
- Volatility
- ZIGZAG
- MESA
- Retracement
- Aroon
INDICATORS LIST
LIST OF TOPICS
PRINT THIS ARTICLE
by Dennis D. Peterson
Following a few simple rules for using Fibonacci retracements should help improve your trading performance.
Position: N/A
Dennis D. Peterson
Market index trading on a daily basis.
PRINT THIS ARTICLE
FIBONACCI
Fibonacci Retracements
07/29/02 01:45:09 PMby Dennis D. Peterson
Following a few simple rules for using Fibonacci retracements should help improve your trading performance.
Position: N/A
| If you've been unsuccessful using Fibonacci retracements maybe it's because you haven't been paying enough attention to the pivots you've chosen for the 0% and 100% points. In my previous article entitled "Nasdaq & Fibonacci Retracement," posted October 5, 2000, I explained the basics of Fibonacci retracement lines: "We hear about one-third and two-third retracements. A two-third retracement is a rough approximation of the ratio of successive numbers in a Fibonacci series --1, 2, 3, 5, 8 . . . Fibonacci numbers are a common occurrence in nature as seen in the number of flower petals and pine cone spirals, to name just two. Does nature play a role in the market? Each number in the series is obtained by adding the previous number, so 2 = 1+1, 3 =1+2, 5 =2+3, 8=3 +5 . . . The ratio of successive numbers is 1/1=1, 1/2=.5, 2/3=.67, 3/5=.6, 5/8=.625, with the ratios converging to .618. Fibonacci retracement is then set at 100%, 50%, 61.8%, 38.2% (38.2=61.8 x .618), and 23.6% (23.6=38.2 x .618). A number of studies have been done to find a correlation between Fibonacci numbers and market prices and success is at best limited. Nevertheless, since it takes only a few minutes to do the calculation, it's hard to resist not taking a look. . . To place Fibonacci retracement lines, choose a peak and a trough for the 0 and 100% points." First, however, remember you are trying to determine support and resistance for a price retracement following a trend. This means that you are going to attach the 0% and 100% at the beginning, and the end of the trend. This means obviously that you wouldn't try to use Fibonacci retracements with saucer or cup patterns, or consolidations. It means that you can only use them on about 20% or 30% of price activity. |
| The most common mistake is not, however, using them only after a trend, but using pivots that are part of exhaustions, either on the buy or sell side. Don't use retracements with pivots where someone paid too much or sold in a panicky fashion. Those pivots are characterized by having large range bars (high - low). They represent an error in trading and you don't want to compound the mistake by using "erroneous" data. Finally, the stronger the trend, the smaller the retracement. How we can take advantage of all of this can be seen in an example of Microsoft (Nasdaq:MSFT). |

|
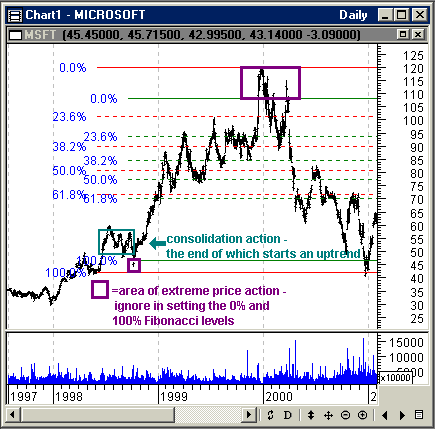
| Figure 1: Daily MSFT Price and Volume. Two Fibonacci retracements have been overlaid. One retracement ignores extreme price action (green) and the other uses the extreme highs and lows (red). In both cases the same uptrend is being analyzed for retracement: the uptrend start is at the end of a consolidation (purple), while the uptrend end is at the double top. The duration of this uptrend, about 14 months from late ’98 to the beginning of 2000, also is the length of time you would use for retracement analysis – namely 14 months. Durations of this length are unusual – three or four months would be more suitable. |
| Graphic provided by: MetaStock. |
| Graphic provided by: Data Vendor: eSignal. |
| |
| First you need to identify the uptrend. I have chosen the price action following a consolidation, and terminated with a double top (Figure 1). I placed two retracements on the uptrend: one ignoring extreme price action and the other using the highest high and lowest low. There doesn't appear to be much of a difference between the two, but in Figure 2, I will blow up an area of interest and show how the difference can affect trading. This is a long time for an uptrend, at least by today's standards. Typically, look for trends that last three or four months. Having drawn your retracement, wait to see how much price will fall and then bounce back up. Unfortunately for long-term holders of MSFT the fall below 61.8% in May 2000 was a bad sign as it likely means the uptrend to $119 /share was weak. The bounce back up to 50% also indicates a weakness. Now you can use that edge to trade MSFT. Remember, it is ALL about buying support and selling resistance. |
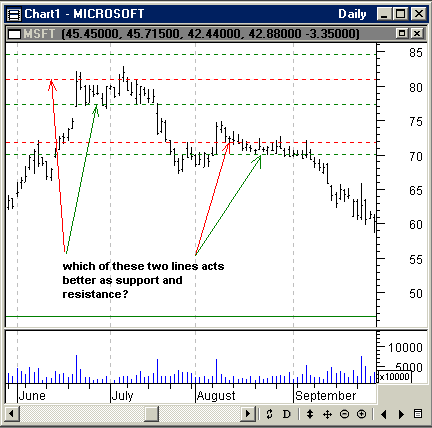
 Figure 2: Retracement lines. After the bounce back up to only 50% (Figure 2: left hand arrow annotations) you are encouraged that the Fibonacci retracements appear to be valid (Figure 2: green dashed line at $77/share) and you also suspect that you should be ready to sell short, or just sell. As you can see the retracement lines (Figure 2: red horizontal dashed lines) using the extremes in highs and lows are not as informative as the retracement lines (Figure 2: green horizontal dashed lines) ignoring extreme behavior. Using the $70/share line as likely point of departure from support to resistance, sell as soon as you see the August move downward. You can repeat the same strategy in December, making over $20/share for your shorts and then again in 2001. Besides building terrific software, MSFT is also highly tradable - what more can you ask of a company? |
Market index trading on a daily basis.
| Title: | Staff Writer |
| Company: | Technical Analysis, Inc. |
| Address: | 4757 California Ave SW |
| Seattle, WA 98116-4499 | |
| Phone # for sales: | 206 938 0570 |
| Fax: | 206 938 1307 |
| Website: | www.traders.com |
| E-mail address: | dpeterson@traders.com |
Traders' Resource Links | |
| Charting the Stock Market: The Wyckoff Method -- Books | |
| Working-Money.com -- Online Trading Services | |
| Traders.com Advantage -- Online Trading Services | |
| Technical Analysis of Stocks & Commodities -- Publications and Newsletters | |
| Working Money, at Working-Money.com -- Publications and Newsletters | |
| Traders.com Advantage -- Publications and Newsletters | |
| Professional Traders Starter Kit -- Software | |
Click here for more information about our publications!
Comments
Date: 07/30/02Rank: 5Comment:
Date: 07/30/02Rank: 5Comment:

|

Request Information From Our Sponsors
- StockCharts.com, Inc.
- Candle Patterns
- Candlestick Charting Explained
- Intermarket Technical Analysis
- John Murphy on Chart Analysis
- John Murphy's Chart Pattern Recognition
- John Murphy's Market Message
- MurphyExplainsMarketAnalysis-Intermarket Analysis
- MurphyExplainsMarketAnalysis-Visual Analysis
- StockCharts.com
- Technical Analysis of the Financial Markets
- The Visual Investor
- VectorVest, Inc.
- Executive Premier Workshop
- One-Day Options Course
- OptionsPro
- Retirement Income Workshop
- Sure-Fire Trading Systems (VectorVest, Inc.)
- Trading as a Business Workshop
- VectorVest 7 EOD
- VectorVest 7 RealTime/IntraDay
- VectorVest AutoTester
- VectorVest Educational Services
- VectorVest OnLine
- VectorVest Options Analyzer
- VectorVest ProGraphics v6.0
- VectorVest ProTrader 7
- VectorVest RealTime Derby Tool
- VectorVest Simulator
- VectorVest Variator
- VectorVest Watchdog
