HOT TOPICS LIST
- MACD
- Fibonacci
- RSI
- Gann
- ADXR
- Stochastics
- Volume
- Triangles
- Futures
- Cycles
- Volatility
- ZIGZAG
- MESA
- Retracement
- Aroon
INDICATORS LIST
LIST OF TOPICS
PRINT THIS ARTICLE
by Koos van der Merwe
Whenever I see a double bottom followed by a triple top on a weekly chart, I always examine the stock more closely.
Position: Sell
Koos van der Merwe
Has been a technical analyst since 1969, and has worked as a futures and options trader with First Financial Futures in Johannesburg, South Africa.
PRINT THIS ARTICLE
First Commonwealth Financial
01/07/13 12:34:53 PMby Koos van der Merwe
Whenever I see a double bottom followed by a triple top on a weekly chart, I always examine the stock more closely.
Position: Sell
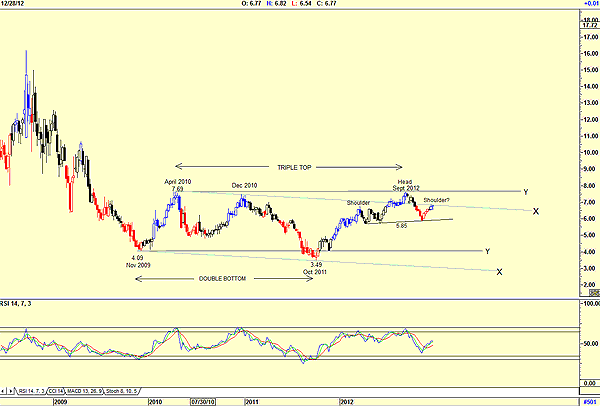
| First Commonwealth Financial (FCF) is a financial services company. It is one of the few stronger banks that did not accept TARP funds in 2008, yet from a high of $15.89 in 2004, the share price collapsed with all banks to a low of $4.09 by November 2009. What attracted me to the share is the double bottom that formed, as can be seen in Figure 1. |

|
| FIGURE 1: FCF, WEEKLY |
| Graphic provided by: AdvancedGET. |
| |
| Figure 1 is a weekly chart of FCF and shows the following: 1. A double bottom formed between November 2009 and October 2011. 2. The price rose from that double bottom, breaking the trendline X after testing it to retest the April 2010 level of $7.69. This formed the resistance line Y. 3. With the share price testing the X trendline, should it start falling, the possibility of a head & shoulders formation exists as shown on the chart. Should this formation occur, then the price could fall to test the Y support line at $4.01 (7.69 - 5.85 = 1.84. 5.85 - 1.84 = 4.01). 4. Should the price break above the X resistance line, it will test the resistance of Y at $7.69. 5. Note the double top that has formed between April 2010 and September 2012. This is a very negative formation. 6. The relative strength index (RSI) has not fallen into the buy zone and suggests that the share price will fall. |

|
| FIGURE 2: FCF, DAILY |
| Graphic provided by: AdvancedGET. |
| |
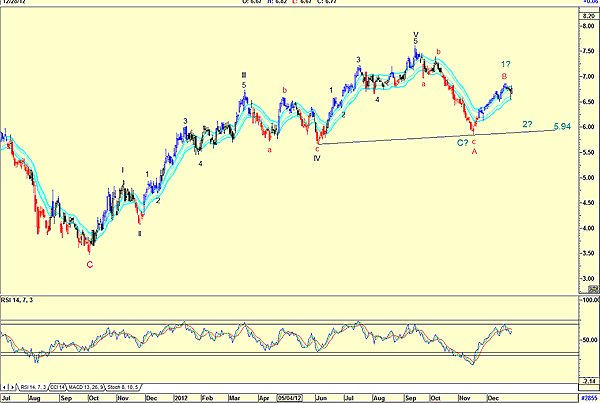
| The daily chart in Figure 2 does show the head & shoulders pattern that could be forming in the weekly chart. The chart shows an Elliott wave count suggesting that a B wave correction is a possibility, with the share price falling into a C wave correction. The RSI, which has not quite reached the sell zone, is suggesting possible negativity. However, as I have shown with a question mark, the B wave could very well be a wave 1 to be followed by a wave 2. The fiscal cliff uncertainty is suggesting a fall in the share price. Whether this will be a C wave or a wave 2 correction will resolve itself with time. Whatever happens fundamentally, a correction is on the cards. At the moment, with uncertainty in the US economy -- politics taking precedence over the benefit to the general citizen -- stocks appear to be trading the new. This is scary. I would be wary of investing in the stock at the moment. However, the stock is on my watchlist. |
Has been a technical analyst since 1969, and has worked as a futures and options trader with First Financial Futures in Johannesburg, South Africa.
| Address: | 3256 West 24th Ave |
| Vancouver, BC | |
| Phone # for sales: | 6042634214 |
| E-mail address: | petroosp@gmail.com |
Click here for more information about our publications!
Comments

|

Request Information From Our Sponsors
- StockCharts.com, Inc.
- Candle Patterns
- Candlestick Charting Explained
- Intermarket Technical Analysis
- John Murphy on Chart Analysis
- John Murphy's Chart Pattern Recognition
- John Murphy's Market Message
- MurphyExplainsMarketAnalysis-Intermarket Analysis
- MurphyExplainsMarketAnalysis-Visual Analysis
- StockCharts.com
- Technical Analysis of the Financial Markets
- The Visual Investor
- VectorVest, Inc.
- Executive Premier Workshop
- One-Day Options Course
- OptionsPro
- Retirement Income Workshop
- Sure-Fire Trading Systems (VectorVest, Inc.)
- Trading as a Business Workshop
- VectorVest 7 EOD
- VectorVest 7 RealTime/IntraDay
- VectorVest AutoTester
- VectorVest Educational Services
- VectorVest OnLine
- VectorVest Options Analyzer
- VectorVest ProGraphics v6.0
- VectorVest ProTrader 7
- VectorVest RealTime Derby Tool
- VectorVest Simulator
- VectorVest Variator
- VectorVest Watchdog
