HOT TOPICS LIST
- MACD
- Fibonacci
- RSI
- Gann
- ADXR
- Stochastics
- Volume
- Triangles
- Futures
- Cycles
- Volatility
- ZIGZAG
- MESA
- Retracement
- Aroon
INDICATORS LIST
LIST OF TOPICS
PRINT THIS ARTICLE
by Koos van der Merwe
When Starbucks enters the political fray with the words "Come together," then the share should be looked at.
Position: Accumulate
Koos van der Merwe
Has been a technical analyst since 1969, and has worked as a futures and options trader with First Financial Futures in Johannesburg, South Africa.
PRINT THIS ARTICLE
ELLIOTT WAVE
Come Together With Starbucks
01/04/13 08:03:08 AMby Koos van der Merwe
When Starbucks enters the political fray with the words "Come together," then the share should be looked at.
Position: Accumulate
| One of the easiest ways to identify a successful business, whether a restaurant, department store, or a coffee shop, is to count the number of people waiting in line to be served. The longer the lineup, the more successful the business, triggering a "buy" for the share based purely on sentiment. With Starbucks (SBUX) stores in Washington, DC, on December 27, 2012, appealing to Congressmen across the political lines to come together and resolve the fiscal cliff debacle on their takeaway cups, the influence of the company can be seen when an aide to the Speaker of the House, John Boehner, tweeted, "My coffee cup did not have the words 'Come together.' " This is a sign of the weight that Starbucks carries in the market. So, do you buy the share? |

|
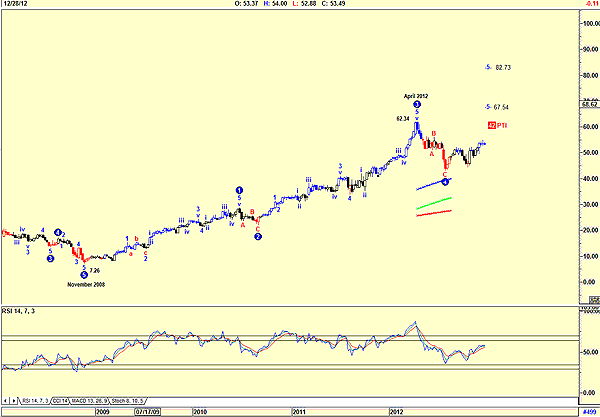
| FIGURE 1: SBUX, WEEKLY. Here's the Elliott wave count. |
| Graphic provided by: AdvancedGET. |
| |
| Figure 1 is a weekly chart showing the Elliott wave count of Starbucks with a target for the top of wave 5 as $67.54 or $82.73. The probability index (PTI) gives it a 42% chance of happening. The rising relative strength index (RSI) is confirming that the price of the share should rise. |

|
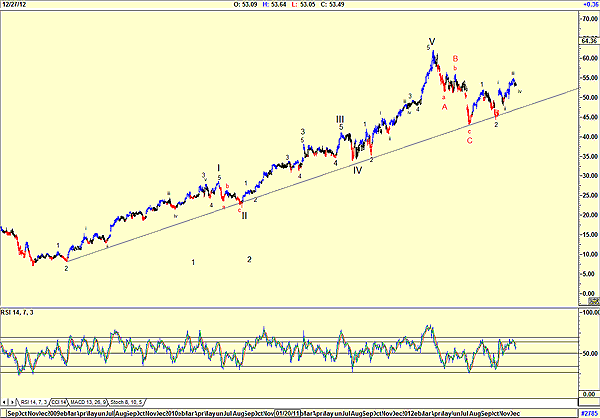
| FIGURE 2: SBUX, DAILY. Here's the daily Elliott wave count. |
| Graphic provided by: AdvancedGET. |
| |
| Figure 2 is a daily chart, showing an Elliott wave count that suggests the share price is in a wave 3 rise of a wave I in a new bull market. The RSI is, however, suggesting weakness ahead. This is confirmed by Figure 3. |

|
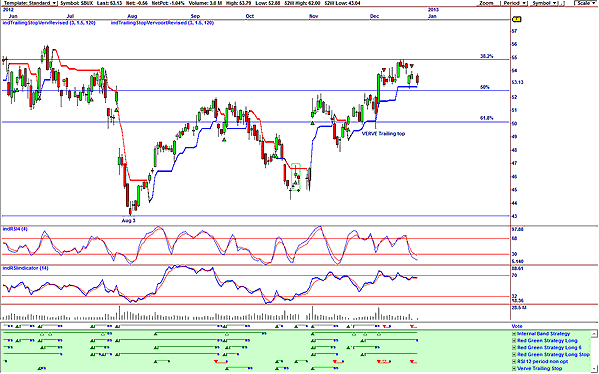
| FIGURE 3: SBUX, DAILY. Here's a suggested short at present levels. |
| Graphic provided by: OmniTrader. |
| |
| Figure 3 has given a sell signal in the vote line, suggesting that the share price could fall further. The Fibonacci retracement shown is from the high of $62.21 on April 16, 2012 (not shown), to the low of $43 of August 3. The price has found support on the Verve trailing stop at approximately the 50% retracement level, and with the RSI four-period in oversold levels, the share price could start forming a bottom. Do note that the internal band strategy in the vote line is still positive, as is the red green strategy long stop. Should Congress put politics aside and look after the interests of the US economy, then Starbucks should rise strongly. |
Has been a technical analyst since 1969, and has worked as a futures and options trader with First Financial Futures in Johannesburg, South Africa.
| Address: | 3256 West 24th Ave |
| Vancouver, BC | |
| Phone # for sales: | 6042634214 |
| E-mail address: | petroosp@gmail.com |
Click here for more information about our publications!
PRINT THIS ARTICLE

|

Request Information From Our Sponsors
- StockCharts.com, Inc.
- Candle Patterns
- Candlestick Charting Explained
- Intermarket Technical Analysis
- John Murphy on Chart Analysis
- John Murphy's Chart Pattern Recognition
- John Murphy's Market Message
- MurphyExplainsMarketAnalysis-Intermarket Analysis
- MurphyExplainsMarketAnalysis-Visual Analysis
- StockCharts.com
- Technical Analysis of the Financial Markets
- The Visual Investor
- VectorVest, Inc.
- Executive Premier Workshop
- One-Day Options Course
- OptionsPro
- Retirement Income Workshop
- Sure-Fire Trading Systems (VectorVest, Inc.)
- Trading as a Business Workshop
- VectorVest 7 EOD
- VectorVest 7 RealTime/IntraDay
- VectorVest AutoTester
- VectorVest Educational Services
- VectorVest OnLine
- VectorVest Options Analyzer
- VectorVest ProGraphics v6.0
- VectorVest ProTrader 7
- VectorVest RealTime Derby Tool
- VectorVest Simulator
- VectorVest Variator
- VectorVest Watchdog
