HOT TOPICS LIST
- MACD
- Fibonacci
- RSI
- Gann
- ADXR
- Stochastics
- Volume
- Triangles
- Futures
- Cycles
- Volatility
- ZIGZAG
- MESA
- Retracement
- Aroon
INDICATORS LIST
LIST OF TOPICS
PRINT THIS ARTICLE
by Donald W. Pendergast, Jr.
Shares of the Market Vectors Gold Miners exchange traded fund are off by more than 18% since late September, but early signs of an impending rebound may be appearing.
Position: N/A
Donald W. Pendergast, Jr.
Freelance financial markets writer and online publisher of the Trendzetterz.com S&P 500 Weekly Forecast service.
PRINT THIS ARTICLE
CHART ANALYSIS
Is GDX Ready To Reverse Upward?
01/03/13 09:52:00 AMby Donald W. Pendergast, Jr.
Shares of the Market Vectors Gold Miners exchange traded fund are off by more than 18% since late September, but early signs of an impending rebound may be appearing.
Position: N/A
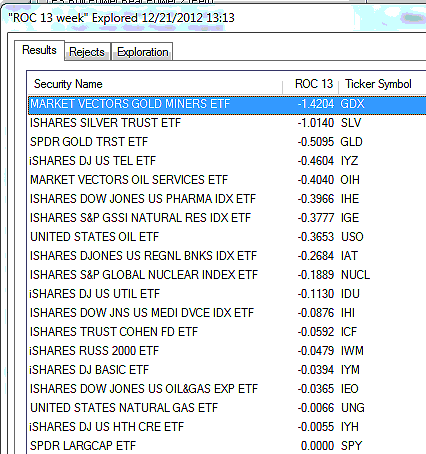
| For gold bugs who base the majority of their buying activity on the long-term fundamentals (high consumer price inflation, economic turmoil, high government debts, and so on) that typically drive up the price of the metal and its related equities, it must be disconcerting every time a sharp correction appears in various segments of this volatile and emotionally charged market. Take the recent slide in gold stock prices since late September 2012. The price movement over the past three months has been steadily lower, with only tiny, short-lived rebounds along the way. The long-term outlook for both gold and gold stocks is still quite bullish, but timing still matters (perhaps more than ever in this market after an 11-plus year bull run). However, the gold stock bulls may soon have another low-risk buying opportunity coming their way. Here's a closer look at it now. (See Figure 1.) |

|
| FIGURE 1: RELATIVE STRENGTH. GDX has been severely lagging the .SPX in terms of relative strength since late September 2012. |
| Graphic provided by: MetaStock. |
| Graphic provided by: MetaStock Explorer. |
| |
| The Market Vectors Gold Miners exchange traded fund (ETF) (GDX) holds a variety of gold producer stock -- big stocks like Newmont Mining (NEM), Barrick Gold (ABX), Agnico-Eagle (AEM), and a number of other mid-cap issues, too. Overall, it does a good job of tracking the broad trends and swings of these stocks, but if you take time and investigate the trading patterns of some of the lesser-known stocks held within GDX, you may find that they have smoother swings and longer-running trends than that of their parent, GDX. So here's an idea to play with as we see an impending multicycle low setting up in GDX: 1. Wait for GDX to issue a mechanical buy signal, such as when its 10-day relative strength index (RSI) crosses above 60 on a daily closing basis. 2. Once you see this buy signal, run a four-week relative strength exploration on all of the GDX component stocks -- against GDX or the .HUI. 3. Look at the top relative strength performers and then plot the same RSI-based triggering mechanism on their respective daily charts. 4. Deploy your capital into the highest relative strength stock that has also made a daily close above an RSI level of 60. |

|
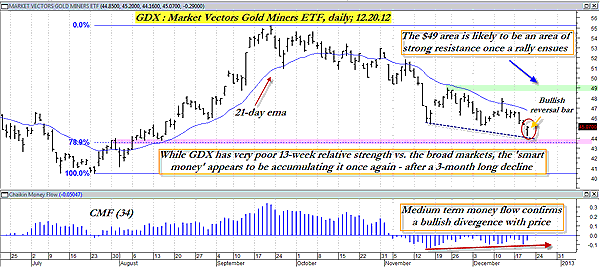
| FIGURE 2: GDX, DAILY. GDX appears to be close to completing a major multicycle low, even as its daily chart is manifesting a bullish price/money flow divergence. Note the latest bullish reversal bar, just above the Fibonacci 79% support of the July-September 2012 rally. |
| Graphic provided by: MetaStock. |
| |
| GDX's daily chart (Figure 2) is manifesting a price/money flow bullish divergence with price, even as it has begun to reverse (note the strongly bullish reversal bar from Thursday, December 20, 2012) higher near the Fibonacci 79% retracement level of its last major bullish swing (July 25 to September 21, 2012), so this is a relatively low-risk way to prospect for gold stocks that have an excellent chance of rocketing higher out of this anticipated cycle low. Once you've located the stock you want to buy, simply place a buy-stop above the high of the price bar that pushed the 10-day RSI over 60, being sure to limit your account risk to 2% or less of your trading account equity. If you are filled on the order, start running a two-bar initial/trailing stop of the daily lows until the trade fizzes out; more conservative investors might want to take half profits if the stock rises by 5%, simply trailing the rest until the final stopout. |
| There are several precious metals stocks with swing/trending characteristics that may be of interest here: 1. Royal Gold (RGLD) 2. Eldorado Gold (EGO) 3. Goldcorp (GG) 4. Iamgold (IAG) 5. Pan American Silver (PAAS) Typically, the swings in these stocks are better than GDX and some of its larger holdings, such as NEM and ABX, so be sure to go through the list of gold and silver miners in your own database (large and midcaps only; disregard the more volatile and speculative junior mining stocks) and confirm that they have a demonstrated ability to make relatively smooth, sustained swing and/or trending moves. It will be time well spent, and you'll likely be rewarded with much better trading system performance once you weed out the poor trending, lackluster stocks from your swing trading stable. Trade wisely until we meet here again. |
Freelance financial markets writer and online publisher of the Trendzetterz.com S&P 500 Weekly Forecast service.
| Title: | Market consultant and writer |
| Company: | Trendzetterz |
| Address: | 81 Hickory Hollow Drive |
| Crossville, TN 38555 | |
| Phone # for sales: | 904-303-4814 |
| Website: | trendzetterz.com |
| E-mail address: | support@trendzetterz.com |
Traders' Resource Links | |
| Trendzetterz has not added any product or service information to TRADERS' RESOURCE. | |
Click here for more information about our publications!
PRINT THIS ARTICLE

Request Information From Our Sponsors
- StockCharts.com, Inc.
- Candle Patterns
- Candlestick Charting Explained
- Intermarket Technical Analysis
- John Murphy on Chart Analysis
- John Murphy's Chart Pattern Recognition
- John Murphy's Market Message
- MurphyExplainsMarketAnalysis-Intermarket Analysis
- MurphyExplainsMarketAnalysis-Visual Analysis
- StockCharts.com
- Technical Analysis of the Financial Markets
- The Visual Investor
- VectorVest, Inc.
- Executive Premier Workshop
- One-Day Options Course
- OptionsPro
- Retirement Income Workshop
- Sure-Fire Trading Systems (VectorVest, Inc.)
- Trading as a Business Workshop
- VectorVest 7 EOD
- VectorVest 7 RealTime/IntraDay
- VectorVest AutoTester
- VectorVest Educational Services
- VectorVest OnLine
- VectorVest Options Analyzer
- VectorVest ProGraphics v6.0
- VectorVest ProTrader 7
- VectorVest RealTime Derby Tool
- VectorVest Simulator
- VectorVest Variator
- VectorVest Watchdog
