HOT TOPICS LIST
- MACD
- Fibonacci
- RSI
- Gann
- ADXR
- Stochastics
- Volume
- Triangles
- Futures
- Cycles
- Volatility
- ZIGZAG
- MESA
- Retracement
- Aroon
INDICATORS LIST
LIST OF TOPICS
PRINT THIS ARTICLE
by Koos van der Merwe
The lady who introduced me to the JM internal band strategy said, and I will never forget her words: "This strategy has been very kind to me."
Position: Buy
Koos van der Merwe
Has been a technical analyst since 1969, and has worked as a futures and options trader with First Financial Futures in Johannesburg, South Africa.
PRINT THIS ARTICLE
ENVELOPES
Cash Is Always King
01/02/13 10:59:36 AMby Koos van der Merwe
The lady who introduced me to the JM internal band strategy said, and I will never forget her words: "This strategy has been very kind to me."
Position: Buy
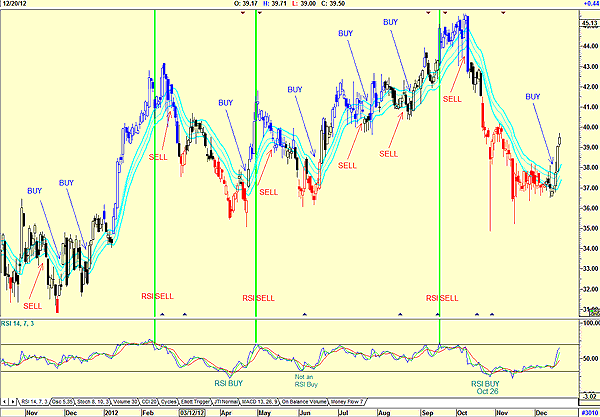
| The JM internal band strategy is a 15-period simple moving average offset by 2% positive and 2% negative. We buy when the price rises above the upper band, and we sell when the price drops below the lower band. That is simple, but can it be improved on? |

|
| FIGURE 1: ORTHOFIX. Showing the JM internal band buy and sell signals with the RSI buy and sell signals. |
| Graphic provided by: AdvancedGET. |
| |
| Looking at the daily share price in Figure 1, we can see how profitable the buy and sell signals have been. We can use the relative strength index (RSI) to confirm a buy signal, but as shown, the RSI buy signal on October 26, 2012, was way too early. We could also use the RSI as a sell signal, and the green vertical lines show that this would be a very effective strategy. So, keeping in mind that it is far safer to be in cash, buy with the JM internal band indicator, and sell with the RSI sell signal. |

|
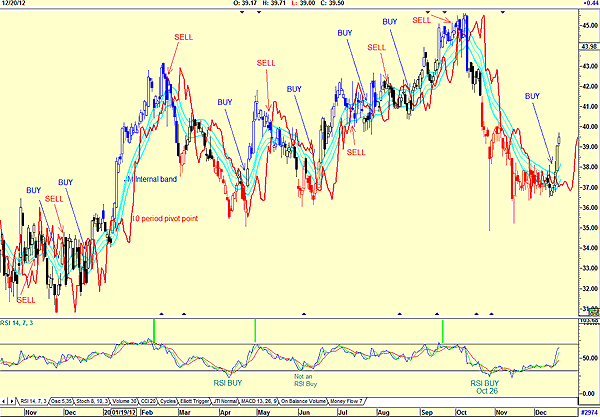
| FIGURE 2: ORTHOFIX. This chart shows the JM internal band buy signals but the 10-period pivot point sell signals. |
| Graphic provided by: AdvancedGET. |
| |
| Figure 2 is a chart of Orthofix showing the JM internal band buy signals, but with a 10-period pivot point sell signal. The red line on the chart is a 10-period moving average of the pivot point 10 days previously. When the closing price of the share breaks below the 10-period pivot point, then a sell signal is triggered. This is another instance where the sell signal is ahead of the JM internal band sell signal. The JM internal band is an indicator for the cautious investor, who prefers buying a share as the price is on the rise. Selling the share and taking good profits is always a good solid strategy. Cash is always king. |
Has been a technical analyst since 1969, and has worked as a futures and options trader with First Financial Futures in Johannesburg, South Africa.
| Address: | 3256 West 24th Ave |
| Vancouver, BC | |
| Phone # for sales: | 6042634214 |
| E-mail address: | petroosp@gmail.com |
Click here for more information about our publications!
Comments

Request Information From Our Sponsors
- StockCharts.com, Inc.
- Candle Patterns
- Candlestick Charting Explained
- Intermarket Technical Analysis
- John Murphy on Chart Analysis
- John Murphy's Chart Pattern Recognition
- John Murphy's Market Message
- MurphyExplainsMarketAnalysis-Intermarket Analysis
- MurphyExplainsMarketAnalysis-Visual Analysis
- StockCharts.com
- Technical Analysis of the Financial Markets
- The Visual Investor
- VectorVest, Inc.
- Executive Premier Workshop
- One-Day Options Course
- OptionsPro
- Retirement Income Workshop
- Sure-Fire Trading Systems (VectorVest, Inc.)
- Trading as a Business Workshop
- VectorVest 7 EOD
- VectorVest 7 RealTime/IntraDay
- VectorVest AutoTester
- VectorVest Educational Services
- VectorVest OnLine
- VectorVest Options Analyzer
- VectorVest ProGraphics v6.0
- VectorVest ProTrader 7
- VectorVest RealTime Derby Tool
- VectorVest Simulator
- VectorVest Variator
- VectorVest Watchdog
