HOT TOPICS LIST
- MACD
- Fibonacci
- RSI
- Gann
- ADXR
- Stochastics
- Volume
- Triangles
- Futures
- Cycles
- Volatility
- ZIGZAG
- MESA
- Retracement
- Aroon
INDICATORS LIST
LIST OF TOPICS
PRINT THIS ARTICLE
by Koos van der Merwe
The market has started recovering, and the banks have moved up with the market.
Position: Buy
Koos van der Merwe
Has been a technical analyst since 1969, and has worked as a futures and options trader with First Financial Futures in Johannesburg, South Africa.
PRINT THIS ARTICLE
MA ENVELOPES
Looking At Three Banks
12/21/12 08:54:26 AMby Koos van der Merwe
The market has started recovering, and the banks have moved up with the market.
Position: Buy
| Banks have taken a beating with the mortgage-backed securities fiasco. Many had to borrow money from the US government, and Lehman Brothers, a global financial firm, declared bankruptcy in 2008. I therefore cannot blame investors for being nervous about reinvesting in banks, but with the fiscal cliff problem in the US closer to be solved, investing in banks now may be the way to go. |

|
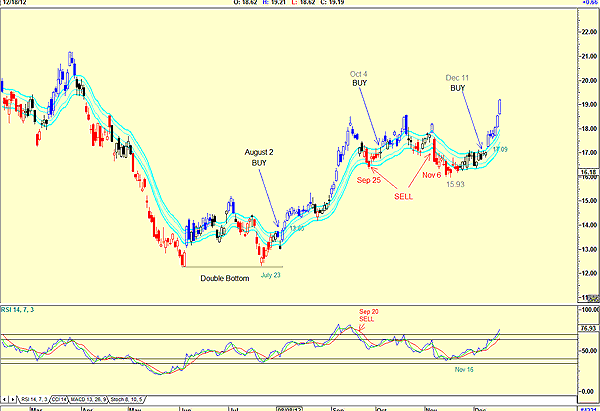
| FIGURE 1: MORGAN STANLEY, DAILY |
| Graphic provided by: AdvancedGET. |
| |
| Figure 1 is a chart of Morgan Stanley (MS). The chart shows how a double bottom formed with the second bottom on July 23. A JM internal band buy signal was given on August 2 when the price of the share was $13.85. The chart shows the JM sell signal on September 25, with the relative strength index (RSI) giving a sell signal earlier, on September 20. A JM buy signal was given on October 4, followed by a sell signal on November 6. This signal would not have been taken because the RSI was negative. On December 11, with the price at $17.09, another buy signal was given with a rising RSI. The RSI gave a buy signal on November 16 when the share price was $15.93. |

|
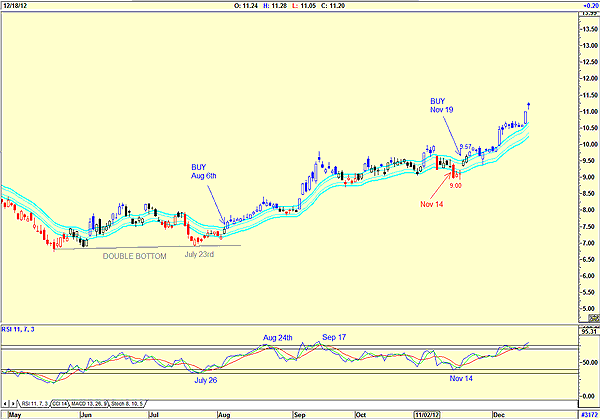
| FIGURE 2: BANK OF AMERICA, DAILY |
| Graphic provided by: AdvancedGET. |
| |
| Bank of America (BAC), shown in Figure 2, shows a double bottom for July 23 with a JM internal band buy signal given on August 6. The RSI suggested a buy for July 26. On November 14, the JM internal band gave a sell signal when the price was $9.00. The RSI suggested a sell on August 24 and again on September 17. On November 19, the JM internal band gave a buy signal when the price was $9.57. At the moment, the RSI is overbought, but a sell signal has not been given. |

|
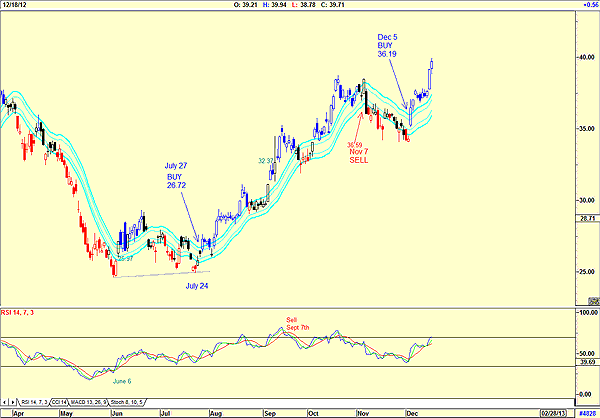
| FIGURE 3: CITIGROUP, DAILY |
| Graphic provided by: AdvancedGET. |
| |
| In Figure 3, a chart of Citigroup (C), we can see that a double bottom formed on July 24 with the JM internal band indicator giving a buy signal on July 27. The RSI gave a buy on June 6 when the price was $25.97. The JM internal band indicator gave a sell signal on November 7 at $36.59, followed by a fresh buy signal on December 5 with the price at $36.19. The RSI gave a sell signal on September 7 when the price closed at $32.37 and has remained in sell mode ever since. Yes, there are many more banks we can look at -- for example, Wells Fargo, a favorite of Warren Buffett. However, the three charts show how well banks have recovered over the past months, with all of them signaling new bull increases in the months ahead. Yes, I would be a long-term investor in banks, using the JM internal band indicator as my buy/sell trigger. |
Has been a technical analyst since 1969, and has worked as a futures and options trader with First Financial Futures in Johannesburg, South Africa.
| Address: | 3256 West 24th Ave |
| Vancouver, BC | |
| Phone # for sales: | 6042634214 |
| E-mail address: | petroosp@gmail.com |
Click here for more information about our publications!
Comments
Date: 12/25/12Rank: Comment: Merry Christmas.
If you get a chance, could you describe the RSI you use?
Thank you
Phil

Request Information From Our Sponsors
- StockCharts.com, Inc.
- Candle Patterns
- Candlestick Charting Explained
- Intermarket Technical Analysis
- John Murphy on Chart Analysis
- John Murphy's Chart Pattern Recognition
- John Murphy's Market Message
- MurphyExplainsMarketAnalysis-Intermarket Analysis
- MurphyExplainsMarketAnalysis-Visual Analysis
- StockCharts.com
- Technical Analysis of the Financial Markets
- The Visual Investor
- VectorVest, Inc.
- Executive Premier Workshop
- One-Day Options Course
- OptionsPro
- Retirement Income Workshop
- Sure-Fire Trading Systems (VectorVest, Inc.)
- Trading as a Business Workshop
- VectorVest 7 EOD
- VectorVest 7 RealTime/IntraDay
- VectorVest AutoTester
- VectorVest Educational Services
- VectorVest OnLine
- VectorVest Options Analyzer
- VectorVest ProGraphics v6.0
- VectorVest ProTrader 7
- VectorVest RealTime Derby Tool
- VectorVest Simulator
- VectorVest Variator
- VectorVest Watchdog
