HOT TOPICS LIST
- MACD
- Fibonacci
- RSI
- Gann
- ADXR
- Stochastics
- Volume
- Triangles
- Futures
- Cycles
- Volatility
- ZIGZAG
- MESA
- Retracement
- Aroon
INDICATORS LIST
LIST OF TOPICS
PRINT THIS ARTICLE
by Chaitali Mohile
Dell is likely to gear up a bullish rally with the robust support of a previous low pivot.
Position: Buy
Chaitali Mohile
Active trader in the Indian stock markets since 2003 and a full-time writer. Trading is largely based upon technical analysis.
PRINT THIS ARTICLE
SUPPORT & RESISTANCE
DELL Ready To Initiate Fresh Rally
12/20/12 01:13:33 PMby Chaitali Mohile
Dell is likely to gear up a bullish rally with the robust support of a previous low pivot.
Position: Buy
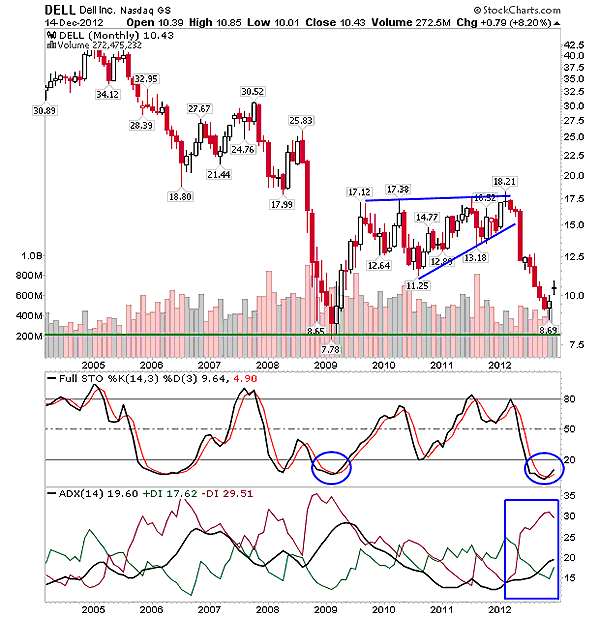
| After a short bullish rally in 2009, Dell Inc. (DELL) consolidated in a tapering range. The sideways price rally continued for about three years, forming an ascending triangle. However, this bullish trend reversal pattern failed due to weak trend and momentum in the rally. An evening star candlestick pattern formed at the tip of the triangle, reversed the previous upward rally and the weak trend. Eventually, DELL plunged to its previous low of $8.69. |
| The full stochastic (14,3,3) slipped from an overbought (80 level) to an oversold region (below 20). In the past, the oscillator surged from oversold territory, initiating the various pullback rallies. A similar technical condition is visible in Figure 1, as the oversold momentum indicator is ready to climb above 20 levels. Hence, DELL has established support at $8.69 levels (see the green line) in Figure 1 and is likely to move in an upward direction. The selling pressure indicated by the negative directional index (-DI) of the average directional index (ADX) (14) is likely to decrease, which would help the stock to begin a relief rally with the previous low support. |

|
| FIGURE 1: DELL, MONTHLY |
| Graphic provided by: StockCharts.com. |
| |
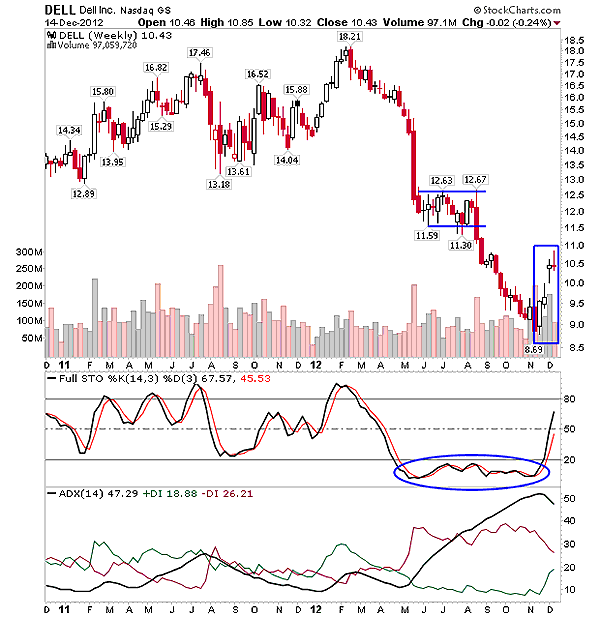
| We can see that DELL has already begun to move upward. The buying pressure (green line) has to increase to cover the bearish trend to the bullish one. This rally is likely to be an open low-risk buying opportunity. |

|
| FIGURE 2: DELL, WEEKLY |
| Graphic provided by: StockCharts.com. |
| |
| The bearish rally on the weekly time frame began with a bearish engulfing candlestick pattern formed at $18.21. The descending price rally of DELL consolidated between 11 and 12 levels, forming a bearish flag & pennant. This pattern in Figure 2, being a bearish continuation, breached downward, resuming the previous bearish rally. The minimum estimated level of this formation is measured by subtracting the length of the flag pole from the breakout point. Therefore, the target level for DELL is 18.21 - 11 = 7.21 (length of the pole) - 11.30 (breakout point) = 4.09. However, an overheated downtrend and highly oversold stochastic terminated the rally much before the estimated levels. Hence, DELL established support at 8.69 levels. |
| The extremely bearish indicators are likely to reverse the current bearish rally, initiating the fresh pullback price action in Figure 2. For a safe buying position, the oscillator has to climb to bullish zones. The full stochastic (14,3,3) has to sustain above the center line, and the existing downtrend should reverse. Considering the bullish signals, traders can trigger the long position above $10 with a small target of $13. Since DELL had consolidated between 11 and 12 levels, the fresh pullback rally is likely to face resistance in this region. Therefore, traders with long positions can just wait and watch the price action at these levels. Thus, the robust support and the highly bearish indicators have reversed the descending rally of DELL. More buying pressure can be expected above $10. |
Active trader in the Indian stock markets since 2003 and a full-time writer. Trading is largely based upon technical analysis.
| Company: | Independent |
| Address: | C1/3 Parth Indraprasth Towers. Vastrapur |
| Ahmedabad, Guj 380015 | |
| E-mail address: | chaitalimohile@yahoo.co.in |
Traders' Resource Links | |
| Independent has not added any product or service information to TRADERS' RESOURCE. | |
Click here for more information about our publications!
PRINT THIS ARTICLE

|

Request Information From Our Sponsors
- VectorVest, Inc.
- Executive Premier Workshop
- One-Day Options Course
- OptionsPro
- Retirement Income Workshop
- Sure-Fire Trading Systems (VectorVest, Inc.)
- Trading as a Business Workshop
- VectorVest 7 EOD
- VectorVest 7 RealTime/IntraDay
- VectorVest AutoTester
- VectorVest Educational Services
- VectorVest OnLine
- VectorVest Options Analyzer
- VectorVest ProGraphics v6.0
- VectorVest ProTrader 7
- VectorVest RealTime Derby Tool
- VectorVest Simulator
- VectorVest Variator
- VectorVest Watchdog
- StockCharts.com, Inc.
- Candle Patterns
- Candlestick Charting Explained
- Intermarket Technical Analysis
- John Murphy on Chart Analysis
- John Murphy's Chart Pattern Recognition
- John Murphy's Market Message
- MurphyExplainsMarketAnalysis-Intermarket Analysis
- MurphyExplainsMarketAnalysis-Visual Analysis
- StockCharts.com
- Technical Analysis of the Financial Markets
- The Visual Investor
