HOT TOPICS LIST
- MACD
- Fibonacci
- RSI
- Gann
- ADXR
- Stochastics
- Volume
- Triangles
- Futures
- Cycles
- Volatility
- ZIGZAG
- MESA
- Retracement
- Aroon
INDICATORS LIST
LIST OF TOPICS
PRINT THIS ARTICLE
by Chaitali Mohile
The converging trendlines of a long-term pattern has restricted the price movement of Chemed Corp. The stock is waiting for a breakout.
Position: N/A
Chaitali Mohile
Active trader in the Indian stock markets since 2003 and a full-time writer. Trading is largely based upon technical analysis.
PRINT THIS ARTICLE
BREAKOUTS
Chemed Corp Racing In Tricky Range
12/19/12 01:12:54 PMby Chaitali Mohile
The converging trendlines of a long-term pattern has restricted the price movement of Chemed Corp. The stock is waiting for a breakout.
Position: N/A
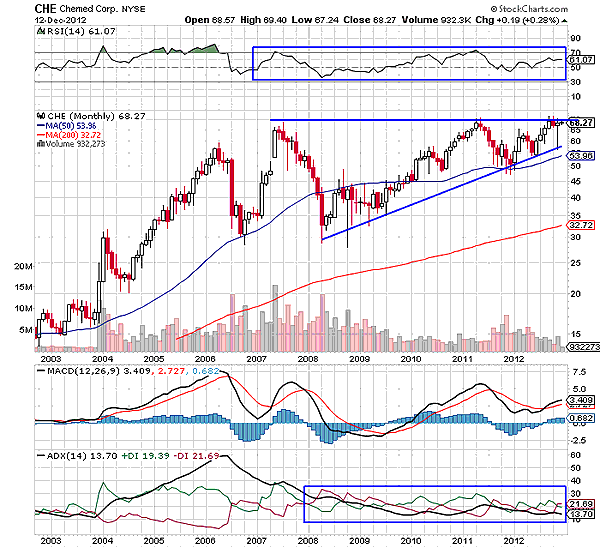
| Chemed Corp (CHE) hardly breached its 50-day moving average (MA) support in 2008. The stock regained support, initiating a pullback rally. This indicated stable bullish strength in the stock. During this process, the price formed higher lows with a steady high, forming an ascending triangle (Figure 1). Since the triangular formation is formed at the top of a volatile bullish rally, we consider it to be a bullish continuous pattern that breaks in an upward direction. |

|
| FIGURE 1: CHE, MONTHLY |
| Graphic provided by: StockCharts.com. |
| |
| The average directional index (ADX) (14) is below 15 levels with tangled positive and negative directional index, suggesting a volatile consolidation. The relative strength index (RSI)(14) is ranging in bullish territory between 50 and 60 levels. The moving average convergence/divergence (MACD) (12,26,9) is rallying in the bullish region above the zero line. The MACD line and the trigger line are frequently zigzagging, suggesting high volatility in the price rally. According to these indicators, CHE is likely to move in the narrowing range of the two trendlines. Currently, an upward breakout is not indicated in Figure 1, but in near future the long-term ascending triangle would breach the upper trendline resistance and resume the prior advance rally. |
| All the indicators have turned completely bullish to initiate the bullish breakout for CHE in the long term. |

|
| FIGURE 2: CHE, DAILY |
| Graphic provided by: StockCharts.com. |
| |
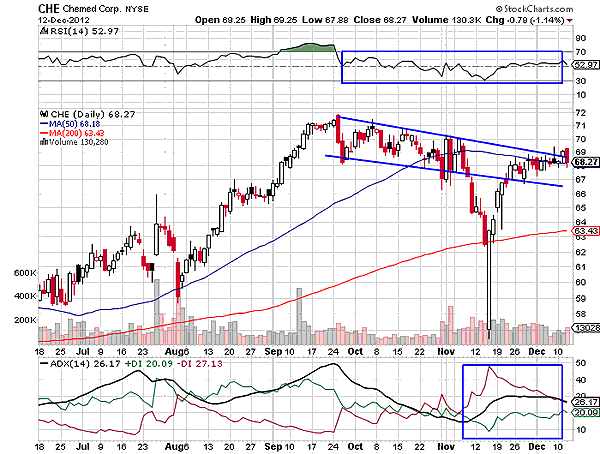
| The stock is descending with support of the 50-day MA on the daily time frame chart in Figure 2. After hitting a top at 72 levels, CHE began declining with huge bearish pressure. In the first two trading sessions CHE plunged to 67 levels, losing almost $5. Thereafter, the stock formed lower highs and lower lows, forming a descending channel. In mid-November, the stock had breached the lower trendline support; however, it recovered immediately. |
| Currently, CHE has formed a bearish engulfing pattern in the support-resistance zone of the 50-day MA and the upper trendline. The candlestick pattern suggests that the stock is ready to retrace toward the lower trendline support. The jittery relative strength index (RSI)(14) and the developing uptrend would dominate price movement. The stock would continue to descend within the channel. Since the trading range is very narrow, volume would remain low. Thus, the converging trendlines of an ascending triangle of CHE would further narrow the trading range. However, traders can remain watchful for the bullish breakout in the near future. |
Active trader in the Indian stock markets since 2003 and a full-time writer. Trading is largely based upon technical analysis.
| Company: | Independent |
| Address: | C1/3 Parth Indraprasth Towers. Vastrapur |
| Ahmedabad, Guj 380015 | |
| E-mail address: | chaitalimohile@yahoo.co.in |
Traders' Resource Links | |
| Independent has not added any product or service information to TRADERS' RESOURCE. | |
Click here for more information about our publications!
PRINT THIS ARTICLE

|

Request Information From Our Sponsors
- StockCharts.com, Inc.
- Candle Patterns
- Candlestick Charting Explained
- Intermarket Technical Analysis
- John Murphy on Chart Analysis
- John Murphy's Chart Pattern Recognition
- John Murphy's Market Message
- MurphyExplainsMarketAnalysis-Intermarket Analysis
- MurphyExplainsMarketAnalysis-Visual Analysis
- StockCharts.com
- Technical Analysis of the Financial Markets
- The Visual Investor
- VectorVest, Inc.
- Executive Premier Workshop
- One-Day Options Course
- OptionsPro
- Retirement Income Workshop
- Sure-Fire Trading Systems (VectorVest, Inc.)
- Trading as a Business Workshop
- VectorVest 7 EOD
- VectorVest 7 RealTime/IntraDay
- VectorVest AutoTester
- VectorVest Educational Services
- VectorVest OnLine
- VectorVest Options Analyzer
- VectorVest ProGraphics v6.0
- VectorVest ProTrader 7
- VectorVest RealTime Derby Tool
- VectorVest Simulator
- VectorVest Variator
- VectorVest Watchdog
