HOT TOPICS LIST
- MACD
- Fibonacci
- RSI
- Gann
- ADXR
- Stochastics
- Volume
- Triangles
- Futures
- Cycles
- Volatility
- ZIGZAG
- MESA
- Retracement
- Aroon
INDICATORS LIST
LIST OF TOPICS
PRINT THIS ARTICLE
by Koos van der Merwe
In uncertain times, it is best to look for stocks that give a good dividend or interest return.
Position: Accumulate
Koos van der Merwe
Has been a technical analyst since 1969, and has worked as a futures and options trader with First Financial Futures in Johannesburg, South Africa.
PRINT THIS ARTICLE
HEAD & SHOULDERS
Looking For Yield
12/18/12 08:10:14 AMby Koos van der Merwe
In uncertain times, it is best to look for stocks that give a good dividend or interest return.
Position: Accumulate
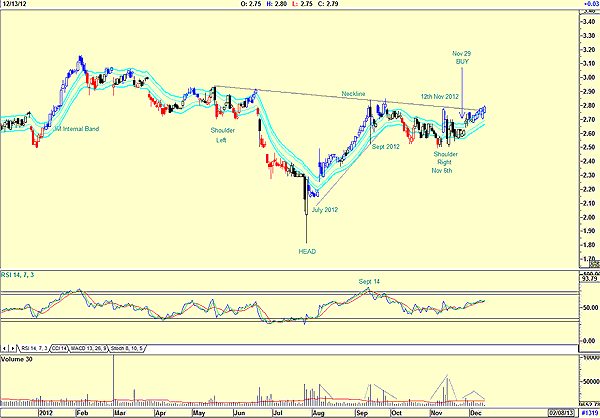
| The inverse head & shoulders pattern indicates a trend reversal from down to up. Volume should pick up as prices rally from the bottom of the head and then increase dramatically on a rally from the right shoulder. Should the neckline be broken on low volume, we must be suspect of the formation. The breakout could be false. A high-volume breakout, on the other hand, would give us good reason to believe that the head & shoulders bottom formation is genuine. |

|
| FIGURE 1: CIM, DAILY |
| Graphic provided by: AdvancedGET. |
| |
| When we look at Figure 1, a daily chart of Chimera Investment Corp., we have to wonder whether this is truly an inverse head & shoulders formation. The pattern, as shown on the chart, does look like it, but as the price rose from July 2012 to September 2012, volume appeared to fall, casting uncertainty on the rise. Volume did rise from November 6 to November 12 but then fell as the price moved above the neckline, once again casting uncertainty. A further cause for uncertainty is the relative strength index (RSI), which is drifting lower from a sell signal given on September 14. The JM internal band did give a buy signal on November 29. (The JM internal band indicator is a 15-period simple moving average offset 2% positive and -2% negative.) A break below the lower band will suggest a sell. |

|
| FIGURE 2: NEWS REPORTS FOR CIM |
| Graphic provided by: Globe and Mail Newspaper. |
| |
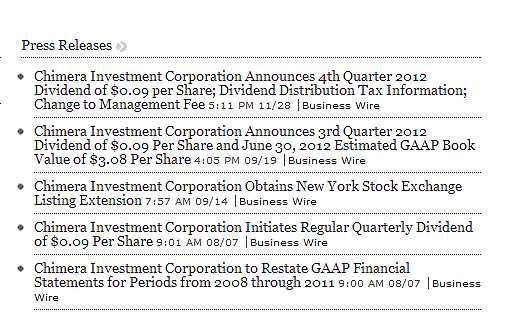
| When we look at the fundamental information taken from Globe Investor, as shown in Figure 2, we see that the company has been pretty consistent in paying its quarterly cash dividend on $0.09 per share payable on January 25, 2013, to shareholders of record December 31, 2012. The ex-dividend date is December 27, 2012. This dividend, with previous dividends, equates a yield of 12.95% per annum, encouraging those investors who are chasing dividends to buy the stock now, and sell as it approaches the December 27th ex-dividend date deadline, if not earlier. What did affect the price of the share, causing it to drop in July, was probably the announcement that it would restate GAAP financial statements for the period 2008 through to 2011, an announcement made on July 8, but this statement has already been discounted into the share price. I would be a buyer of CIM at current levels, but with the intention of selling the share on a growth profit before December 27 if not earlier, depending on the RSI or a sell signal given by the JM internal band. |
Has been a technical analyst since 1969, and has worked as a futures and options trader with First Financial Futures in Johannesburg, South Africa.
| Address: | 3256 West 24th Ave |
| Vancouver, BC | |
| Phone # for sales: | 6042634214 |
| E-mail address: | petroosp@gmail.com |
Click here for more information about our publications!
PRINT THIS ARTICLE

Request Information From Our Sponsors
- StockCharts.com, Inc.
- Candle Patterns
- Candlestick Charting Explained
- Intermarket Technical Analysis
- John Murphy on Chart Analysis
- John Murphy's Chart Pattern Recognition
- John Murphy's Market Message
- MurphyExplainsMarketAnalysis-Intermarket Analysis
- MurphyExplainsMarketAnalysis-Visual Analysis
- StockCharts.com
- Technical Analysis of the Financial Markets
- The Visual Investor
- VectorVest, Inc.
- Executive Premier Workshop
- One-Day Options Course
- OptionsPro
- Retirement Income Workshop
- Sure-Fire Trading Systems (VectorVest, Inc.)
- Trading as a Business Workshop
- VectorVest 7 EOD
- VectorVest 7 RealTime/IntraDay
- VectorVest AutoTester
- VectorVest Educational Services
- VectorVest OnLine
- VectorVest Options Analyzer
- VectorVest ProGraphics v6.0
- VectorVest ProTrader 7
- VectorVest RealTime Derby Tool
- VectorVest Simulator
- VectorVest Variator
- VectorVest Watchdog
