HOT TOPICS LIST
- MACD
- Fibonacci
- RSI
- Gann
- ADXR
- Stochastics
- Volume
- Triangles
- Futures
- Cycles
- Volatility
- ZIGZAG
- MESA
- Retracement
- Aroon
INDICATORS LIST
LIST OF TOPICS
PRINT THIS ARTICLE
by Donald W. Pendergast, Jr.
Shares of Cisco Systems have enjoyed a solid rally for the past five weeks, but the rally appears to be treading on thin ice.
Position: N/A
Donald W. Pendergast, Jr.
Freelance financial markets writer and online publisher of the Trendzetterz.com S&P 500 Weekly Forecast service.
PRINT THIS ARTICLE
CYCLES
Cisco Systems Running Out Of Fuel?
12/17/12 08:39:51 AMby Donald W. Pendergast, Jr.
Shares of Cisco Systems have enjoyed a solid rally for the past five weeks, but the rally appears to be treading on thin ice.
Position: N/A
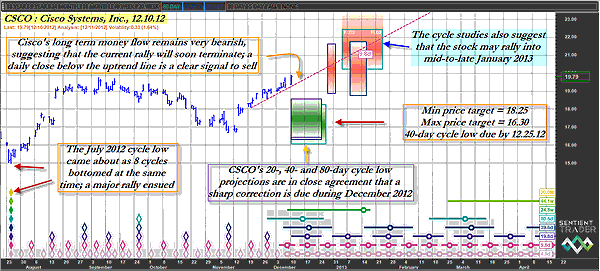
| Stock market rallies just make everyone feel so good; you have the joy of knowing your stock positions are rising, you feel wealthier, smarter, and pretty much think the entire world is your own personal bowl of cherries -- until the rally stalls and you begin to run for cover with the rest of the herd, looking for someone to blame (it's never your fault, of course) and for a can't-lose newsletter advisor or trading system so you'll be shielded from such pain again (or so you think). Well, a scenario like this is likely to take center stage in shares of Cisco Systems, Inc. (CSCO). A long-running, 20-week rally since July is about to end, with many happy CSCO partiers left holding the proverbial bag once a key uptrend line is violated to the downside -- most likely sooner rather than later. Here's a closer look now, one that could save you from unnecessary profit givebacks or outright losses if you're currently long this large-cap tech titan's shares. See Figure 1. |

|
| FIGURE 1: CSCO. With three sequential price cycles in agreement that CSCO is likely to decline into late December 2012, wise traders and investors will use a daily close below the trendline on the chart as their signal to close existing long positions in the stock. |
| Graphic provided by: Sentient Trader. |
| |
| After eight of its most crucial price cycles all bottomed together on July 25, 2012, CSCO began a two-stage bullish run, managing a gain of 33% over a 20-week timespan. The 62% retracement of the initial rise out of the July 2012 lows wasn't all that surprising, as CSCO's long-term Chaikin money flow (CMF)(100) has been stuck in negative territory (below its zero line) since June 7, 2012, never once having been in its bullish zone since then. The current rally up from CSCO's latest minor cycle low (on November 9, 2012) in CSCO has been unexpectedly strong in light of the anemic money flow, and unless some unusually urgent buying power finds its way into this stock soon, there is a very high probability of a trend reversal and/or correction against its existing trend. See Figure 2. |

|
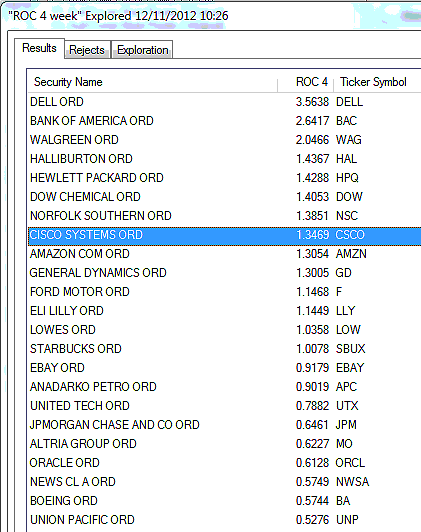
| FIGURE 2: CSCO. A wide cross-section of .OEX component stocks has been outperforming the .SPX over the past four weeks. |
| Graphic provided by: MetaStock. |
| Graphic provided by: MetaStock Explorer. |
| |
| Looking at CSCO's daily price cycles graph, we find additional technical clues that also suggest that this stock may drop as hard and as fast as Newton's apple (remember his theory of gravity?), particularly if the valid trendline (VTL) shown on the chart is violated to the downside on a daily close. If and when this apple gets pulled down by the market forces of weak money flow and powerful price cycle convergence, it's likely to fall right into the green time/price projection basket formed by the combined forecasted cycle lows on three separate time frames -- the 20-, 40- and 80-day cycles. Typically, when three adjacent cycles all agree so closely on forecasted time/price target zones, the probabilities of a given stock or index actually meeting the minimum targets is exceptionally high. Anyone currently long shares of CSCO needs to give careful consideration as to whether they should do the following to protect any long (and hopefully already profitable) positions in this major tech issue: 1. Begin scaling out of your most profitable open positions, running a close trailing stop on the rest (just use the trendline on the chart if you like) 2. Sell all current longs and go to cash, waiting for CSCO's next low-risk buy opportunity, which may occur in January 2013. Speculative bears in CSCO might want to acquire some mildly in-the-money puts with two to three months of time value, looking for a decline below the VTL and a subsequent selloff down toward the 17.50 to 18.00 area. If you go this route in CSCO, be sure to keep your account risk on this trade at about 1% to 2%, using the 17.50/18.00 as your only exit. If your long puts should decline in value by 50% or if CSCO hits $20 after you buy them, just sell them for a loss and wait for a better trade setup. Overall, however, this looks like a great put buying opportunity for skilled option traders. |
Freelance financial markets writer and online publisher of the Trendzetterz.com S&P 500 Weekly Forecast service.
| Title: | Market consultant and writer |
| Company: | Trendzetterz |
| Address: | 81 Hickory Hollow Drive |
| Crossville, TN 38555 | |
| Phone # for sales: | 904-303-4814 |
| Website: | trendzetterz.com |
| E-mail address: | support@trendzetterz.com |
Traders' Resource Links | |
| Trendzetterz has not added any product or service information to TRADERS' RESOURCE. | |
Click here for more information about our publications!
PRINT THIS ARTICLE

Request Information From Our Sponsors
- StockCharts.com, Inc.
- Candle Patterns
- Candlestick Charting Explained
- Intermarket Technical Analysis
- John Murphy on Chart Analysis
- John Murphy's Chart Pattern Recognition
- John Murphy's Market Message
- MurphyExplainsMarketAnalysis-Intermarket Analysis
- MurphyExplainsMarketAnalysis-Visual Analysis
- StockCharts.com
- Technical Analysis of the Financial Markets
- The Visual Investor
- VectorVest, Inc.
- Executive Premier Workshop
- One-Day Options Course
- OptionsPro
- Retirement Income Workshop
- Sure-Fire Trading Systems (VectorVest, Inc.)
- Trading as a Business Workshop
- VectorVest 7 EOD
- VectorVest 7 RealTime/IntraDay
- VectorVest AutoTester
- VectorVest Educational Services
- VectorVest OnLine
- VectorVest Options Analyzer
- VectorVest ProGraphics v6.0
- VectorVest ProTrader 7
- VectorVest RealTime Derby Tool
- VectorVest Simulator
- VectorVest Variator
- VectorVest Watchdog
