HOT TOPICS LIST
- MACD
- Fibonacci
- RSI
- Gann
- ADXR
- Stochastics
- Volume
- Triangles
- Futures
- Cycles
- Volatility
- ZIGZAG
- MESA
- Retracement
- Aroon
INDICATORS LIST
LIST OF TOPICS
PRINT THIS ARTICLE
by Donald W. Pendergast, Jr.
Up by nearly 16% in the last six weeks, shares of Anadarko Petroleum continue to charge higher, seeking its next multicycle high by mid- to late December 2012.
Position: N/A
Donald W. Pendergast, Jr.
Freelance financial markets writer and online publisher of the Trendzetterz.com S&P 500 Weekly Forecast service.
PRINT THIS ARTICLE
CYCLES
APC Surging Toward A Multicycle High?
12/14/12 12:20:21 PMby Donald W. Pendergast, Jr.
Up by nearly 16% in the last six weeks, shares of Anadarko Petroleum continue to charge higher, seeking its next multicycle high by mid- to late December 2012.
Position: N/A
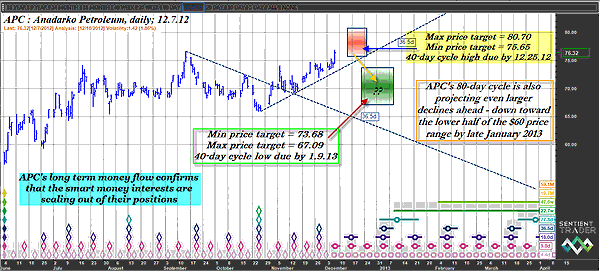
| Anadarko Petroleum (APC) is a fairly volatile stock, and that means that swing traders and even a few trend-followers have a keen interest in finding low-risk entry opportunities in this key energy player's stock. Its current upswing, one birthed in the minor cycle low of October 25, 2012, is up about 16% so far and has even managed to take out September's swing high of 76.63 in the process. At first glance, the stock appears to be in fine technical shape, but a closer look at a couple of key indicators and studies is warning in advance that APC's current rally may be closer to its end than it is to its beginning. Here's a closer look now (Figure 1). |

|
| FIGURE 1: APC, DAILY. APC's current rally will remain intact until it makes a daily close below its current uptrend line. The stock has an extremely bearish, negatively diverging long-term money flow trend; selling could be strong and such a break of support. |
| Graphic provided by: Sentient Trader. |
| |
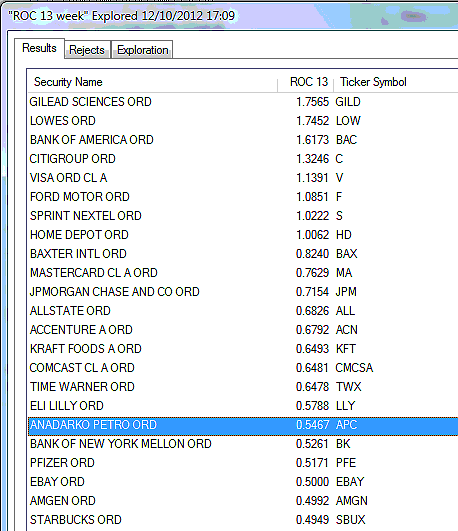
| First, the good technical news for existing longs in APC: 1. The stock is still trending very nicely, well above its 36.5-day valid trendline (VTL). This is the upsloping line on the chart and is, in fact, the line in the sand that is defining APC's recent rally. 2. APC's 40-day cycle high time/price projections (red box) is forecasting a high probability of more gains between now and December 25, 2012. 3. The stock is easily beating out the .SPX in terms of 13-week relative strength. So for the next few weeks, current longs in APC should be okay, provided that they use the trendline shown as a trailing stop (or some sort of a price channel or trailing volatility stop) or begin to acquire put options as insurance. However, once APC makes it into the red zone and/or makes a daily close below the trend line, all short- to medium-term longs in APC would be well advised to close them out -- hopefully at a nice gain. A prime reason to sell on such a decline is the fact that APC's long-term Chaikin money flow histogram (CMF)(100) has been in a strong negative divergence with price for the past month, which is a sure-fire confirmation that the smart money interests in this stock are already starting to head for the hills, selling their shares to lesser-informed traders who are late to APC's latest rally. APC's 80-day cycle high projection has nearly identical time/price parameters as its 40-day cycle, yet another tipoff that this current bullish rise is closing in fast on its ultimate (but as yet unknown) peak. |

|
| FIGURE 2: OUTPERFORMING THE .SPX. Anadarko Petroleum (APC) has been outperforming the .SPX over the last calendar quarter and is also stronger than other energy sector components within the .OEX. |
| Graphic provided by: MetaStock. |
| Graphic provided by: MetaStock Explorer. |
| |
| Once APC finally does peak -- probably before Christmas 2012 -- the green shaded box offers the best educated guess as to where the stock will likely seek to put in its next 40-day cycle low. This event is projected to occur before January 10, 2013, with the minimum low being 73.68 and the maximum low being 67.09. APC's 80-day cycle low forecast is calling for an even deeper decline, down to a maximum low of 62.89 by January 29, 2013. See Figure 2. Again, because of the extremely bearish money flow trend in the stock, it might pay for traders and investors to anticipate a larger than expected decline in APC as we head into the new year. As far as playing a decline in APC, why not just buy some slightly in-the-money (ITM) put options (with at least two months of time value remaining) after you see a daily close below the top trendline? Use the top of the green price zone as your initial profit target and you might be rewarded with a relatively fast and trouble-free selloff, one that could help you finish out 2012 in profitable style. As always, limit your trade risk to a maximum of 1% to 2% of your account equity and trade wisely until we meet here again. |
Freelance financial markets writer and online publisher of the Trendzetterz.com S&P 500 Weekly Forecast service.
| Title: | Market consultant and writer |
| Company: | Trendzetterz |
| Address: | 81 Hickory Hollow Drive |
| Crossville, TN 38555 | |
| Phone # for sales: | 904-303-4814 |
| Website: | trendzetterz.com |
| E-mail address: | support@trendzetterz.com |
Traders' Resource Links | |
| Trendzetterz has not added any product or service information to TRADERS' RESOURCE. | |
Click here for more information about our publications!
PRINT THIS ARTICLE

Request Information From Our Sponsors
- StockCharts.com, Inc.
- Candle Patterns
- Candlestick Charting Explained
- Intermarket Technical Analysis
- John Murphy on Chart Analysis
- John Murphy's Chart Pattern Recognition
- John Murphy's Market Message
- MurphyExplainsMarketAnalysis-Intermarket Analysis
- MurphyExplainsMarketAnalysis-Visual Analysis
- StockCharts.com
- Technical Analysis of the Financial Markets
- The Visual Investor
- VectorVest, Inc.
- Executive Premier Workshop
- One-Day Options Course
- OptionsPro
- Retirement Income Workshop
- Sure-Fire Trading Systems (VectorVest, Inc.)
- Trading as a Business Workshop
- VectorVest 7 EOD
- VectorVest 7 RealTime/IntraDay
- VectorVest AutoTester
- VectorVest Educational Services
- VectorVest OnLine
- VectorVest Options Analyzer
- VectorVest ProGraphics v6.0
- VectorVest ProTrader 7
- VectorVest RealTime Derby Tool
- VectorVest Simulator
- VectorVest Variator
- VectorVest Watchdog
