HOT TOPICS LIST
- MACD
- Fibonacci
- RSI
- Gann
- ADXR
- Stochastics
- Volume
- Triangles
- Futures
- Cycles
- Volatility
- ZIGZAG
- MESA
- Retracement
- Aroon
INDICATORS LIST
LIST OF TOPICS
PRINT THIS ARTICLE
by Billy Williams
Price action is one of the least-understood functions of the market as well as the most taken for granted, yet knowing these two core factors can help you profit consistently.
Position: Hold
Billy Williams
Billy Williams has been trading the markets for 27 years, specializing in momentum trading with stocks and options.
PRINT THIS ARTICLE
TECHNICAL ANALYSIS
Perspective, Strategy, Price Action
12/14/12 12:13:13 PMby Billy Williams
Price action is one of the least-understood functions of the market as well as the most taken for granted, yet knowing these two core factors can help you profit consistently.
Position: Hold
| Ask any set of traders what price action is and you are likely to walk away as confused about the subject as any beginner on the subject. Many traders feel that the study and definition of price action are nebulous and can't be quantified, while the rest find in its meaning the focus of candlestick bars, price charts, and Elliott wave analysis, among others. The answer is a combination of yes and no, as its definition can lie in large part on the perspective of the trader himself and with that perspective the foundation of his success or failure. In Japanese culture, the "art of strategy" is more than a surface-level approach to war and combat, but in that culture, it has deep roots in all walks of life. From the classroom, battlefield, boardroom, and even to raising a successful strategy, the study of strategy is all-encompassing into every facet of life. A key principle of strategy is mental or how you view something. Often, a change in perspective in how you perceive something is a shift in strategy itself, which allows you to view something differently and discover new approaches and resources to emerge victorious. |

|
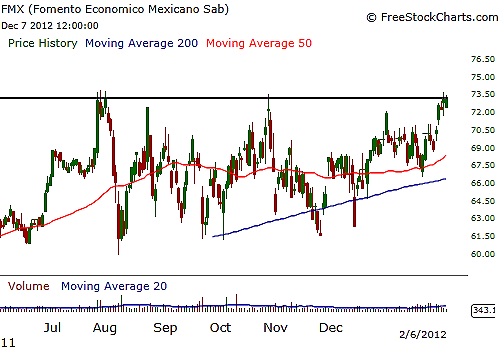
| FIGURE 1: FMX. FMX endured a multimonth period where resistive forces were keeping the stock's ascent in check and held captive within a tight trading range. |
| Graphic provided by: www.freestockcharts.com. |
| |
| In studying price action, price is something that moves through time. The "action" part of the phrase is a verb that indicates it is constantly adapting; it does not rely on past events to predict its next move. Price action then describes market movement itself in the form of patterns, what it has done up to this point in time and where its movement gives a glimpse of what it is going to do next. The book "The Art And Science Of Technical Analysis" by Adam Grimes details two opposing forces that form the basis for the formation of market structure -- motive force and resistive force. Each force resists the other and when an imbalance is formed, trends emerge or else price is static with trading ranges being formed. See Figure 1. |

|
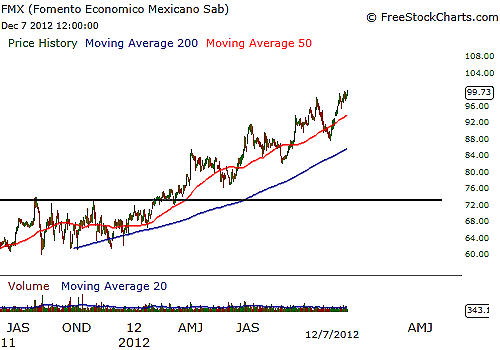
| FIGURE 2: FMX. Eventually, the bulls gathered enough motive force to overcome the bears and set the stock in motion and on its way to higher valuations. |
| Graphic provided by: www.freestockcharts.com. |
| |
| For example, if new information is introduced about a stock, buyers will likely jump in to buy up shares where they can be identified as the motive force that has the intention of accumulating a position. Resistive force enters the market as bears attempt to force price down by shorting the market. Now, they may not be able to muster enough force to fend off the bulls, but their resistance creates wild and sharp gyrations in price as the stock climbs higher. See Figure 2. This cycle is played out over and over again every day, forming the sum total of all analysis and trade decision at any given point in time. And it is this tug-of-war that moves the market from trending to trading range, up and down, and is the basis of price action and the cornerstone of technical analysis. This perspective gives a strong edge as you develop a pragmatic strategy to exploit price action profitability as these forces come into play. |
Billy Williams has been trading the markets for 27 years, specializing in momentum trading with stocks and options.
| Company: | StockOptionSystem.com |
| E-mail address: | stockoptionsystem.com@gmail.com |
Traders' Resource Links | |
| StockOptionSystem.com has not added any product or service information to TRADERS' RESOURCE. | |
Click here for more information about our publications!
Comments

Request Information From Our Sponsors
- StockCharts.com, Inc.
- Candle Patterns
- Candlestick Charting Explained
- Intermarket Technical Analysis
- John Murphy on Chart Analysis
- John Murphy's Chart Pattern Recognition
- John Murphy's Market Message
- MurphyExplainsMarketAnalysis-Intermarket Analysis
- MurphyExplainsMarketAnalysis-Visual Analysis
- StockCharts.com
- Technical Analysis of the Financial Markets
- The Visual Investor
- VectorVest, Inc.
- Executive Premier Workshop
- One-Day Options Course
- OptionsPro
- Retirement Income Workshop
- Sure-Fire Trading Systems (VectorVest, Inc.)
- Trading as a Business Workshop
- VectorVest 7 EOD
- VectorVest 7 RealTime/IntraDay
- VectorVest AutoTester
- VectorVest Educational Services
- VectorVest OnLine
- VectorVest Options Analyzer
- VectorVest ProGraphics v6.0
- VectorVest ProTrader 7
- VectorVest RealTime Derby Tool
- VectorVest Simulator
- VectorVest Variator
- VectorVest Watchdog
