HOT TOPICS LIST
- MACD
- Fibonacci
- RSI
- Gann
- ADXR
- Stochastics
- Volume
- Triangles
- Futures
- Cycles
- Volatility
- ZIGZAG
- MESA
- Retracement
- Aroon
INDICATORS LIST
LIST OF TOPICS
PRINT THIS ARTICLE
by Chaitali Mohile
DISH Network Corp has recovered from all its previous losses. The price action near this resistance has to be observed carefully.
Position: N/A
Chaitali Mohile
Active trader in the Indian stock markets since 2003 and a full-time writer. Trading is largely based upon technical analysis.
PRINT THIS ARTICLE
SUPPORT & RESISTANCE
DISH Nears Previous High
12/13/12 11:38:20 AMby Chaitali Mohile
DISH Network Corp has recovered from all its previous losses. The price action near this resistance has to be observed carefully.
Position: N/A
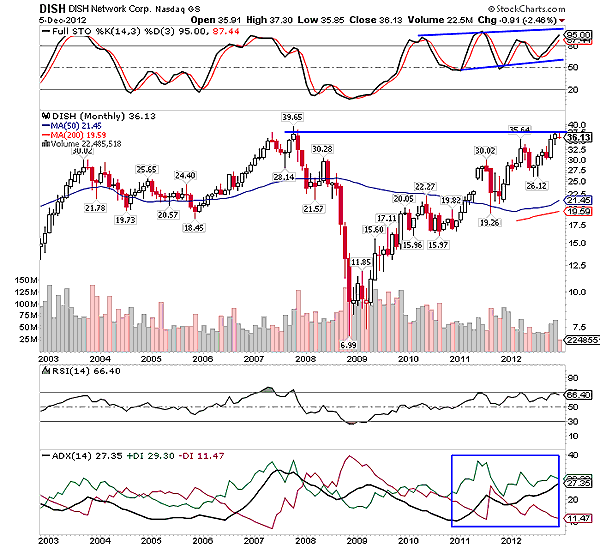
| The financial crunch of 2008 pulled down DISH Network Corp. (DISH) from $40 to a single-digit value of $6.99. The stock underwent this correction for a few months, but it took almost three years to regain those lost price levels. After forming a strong bottom in 2009, DISH began a fresh bullish journey. Initially, the bearish pressure was very high, and as a result, the stock was unable to sustain near its intermediate peaks. The long upper shadows that formed at the bottom shows bearish force in the rally. Gradually, the stock converted the 50-day moving average (MA) resistance to support. This marginally increased volume. |

|
| FIGURE 1: DISH, MONTHLY |
| Graphic provided by: StockCharts.com. |
| |
| A bullish moving average breakout reversed a weak trend to a fresh uptrend. The average directional index (ADX) (14) surged above 20 levels with robust buying pressure, developing the bullish trend for DISH. The relative strength index (RSI) (14) moved in a bullish region above 50 levels; however, it later got stuck between 50 and 60 levels. Though the stock surged higher, forming a series of higher highs and higher lows, the RSI oscillator moved horizontally. The upward moving full stochastic (14,3,3) showed a developing bullish momentum. |
| Currently, DISH has hit its previous high of $39.65 in 2008. Although all the oscillators in Figure 1 are healthily bullish, the stock is likely to slow down near this resistance line. The robust bearish pressure near 39.65 levels could initiate a minor downward rally. Since the uptrend, bullish strength, and momentum are stable, DISH would not undergo serious correction in the near future. |

|
| FIGURE 2: DISH, WEEKLY |
| Graphic provided by: StockCharts.com. |
| |
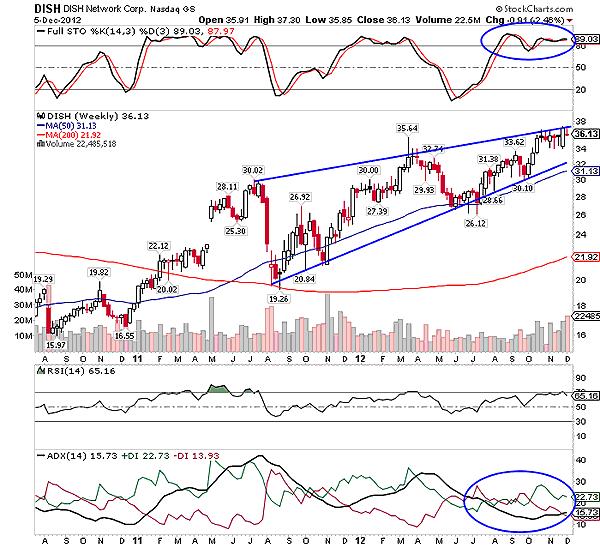
| DISH has formed a long-term rising wedge on the weekly time frame chart in Figure 2. The bearish reversal pattern has not yet matured to undergo a bearish breakout. The two converging trendlines have narrowed the trading range of DISH. Currently, the price has hit the upper trendline resistance, but a bullish breakout is not reflected on the price chart. An overbought stochastic would retrace the price rally toward the lower trendline support. The stock is likely to move within the narrowing range for the next few weeks. |
| The ADX (14) in Figure 2 is still weak to initiate the breakout in any direction. The RSI (14) is unable to surge in an overbought territory. The daily chart is indicating mixed views, suggesting a volatile price action within the narrowing range. Technically, the rising wedge initiates a bearish rally. The bearish pattern in Figure 2 has immediate support of the 50-day moving average (MA). If the downside breakout occurs, the short-term moving average would extend strong support to the stock. Hence, the volatility of DISH near resistance would increase but it would not lose its bullishness in the next few trading weeks. |
Active trader in the Indian stock markets since 2003 and a full-time writer. Trading is largely based upon technical analysis.
| Company: | Independent |
| Address: | C1/3 Parth Indraprasth Towers. Vastrapur |
| Ahmedabad, Guj 380015 | |
| E-mail address: | chaitalimohile@yahoo.co.in |
Traders' Resource Links | |
| Independent has not added any product or service information to TRADERS' RESOURCE. | |
Click here for more information about our publications!
PRINT THIS ARTICLE

Request Information From Our Sponsors
- StockCharts.com, Inc.
- Candle Patterns
- Candlestick Charting Explained
- Intermarket Technical Analysis
- John Murphy on Chart Analysis
- John Murphy's Chart Pattern Recognition
- John Murphy's Market Message
- MurphyExplainsMarketAnalysis-Intermarket Analysis
- MurphyExplainsMarketAnalysis-Visual Analysis
- StockCharts.com
- Technical Analysis of the Financial Markets
- The Visual Investor
- VectorVest, Inc.
- Executive Premier Workshop
- One-Day Options Course
- OptionsPro
- Retirement Income Workshop
- Sure-Fire Trading Systems (VectorVest, Inc.)
- Trading as a Business Workshop
- VectorVest 7 EOD
- VectorVest 7 RealTime/IntraDay
- VectorVest AutoTester
- VectorVest Educational Services
- VectorVest OnLine
- VectorVest Options Analyzer
- VectorVest ProGraphics v6.0
- VectorVest ProTrader 7
- VectorVest RealTime Derby Tool
- VectorVest Simulator
- VectorVest Variator
- VectorVest Watchdog
