HOT TOPICS LIST
- MACD
- Fibonacci
- RSI
- Gann
- ADXR
- Stochastics
- Volume
- Triangles
- Futures
- Cycles
- Volatility
- ZIGZAG
- MESA
- Retracement
- Aroon
INDICATORS LIST
LIST OF TOPICS
PRINT THIS ARTICLE
by Mike Carr, CMT
Many indicators were developed years ago, long before computers allowed for backtesting. Recently, a new form of the relative strength index was introduced, and testing shows it has improved on the older version.
Position: Sell
Mike Carr, CMT
Mike Carr, CMT, is a member of the Market Technicians Association, and editor of the MTA's newsletter, Technically Speaking. He is also the author of "Smarter Investing in Any Economy: The Definitive Guide to Relative Strength Investing," and "Conquering the Divide: How to Use Economic Indicators to Catch Stock Market Trends."
PRINT THIS ARTICLE
REL. STR OSCILL
RSI Can Be Improved
12/12/12 11:02:05 AMby Mike Carr, CMT
Many indicators were developed years ago, long before computers allowed for backtesting. Recently, a new form of the relative strength index was introduced, and testing shows it has improved on the older version.
Position: Sell
| The relative strength index (RSI) was first introduced to traders in 1978 by J. Welles Wilder. Use of the indicator was well documented in Wilder's book "New Concepts In Technical Trading Systems," which offered examples of RSI on charts. Wilder explained that it could be used as an oscillator, analyzed with chart patterns or as a useful tool for spotting divergences. None of these ideas was tested at the time because testing capabilities were not as readily available as they are now. A lack of proof had no impact on the widespread acceptance of RSI, which became one of the most widely studied and well-followed indicators available. Other analysts have shown that range rules offer a better perspective on when RSI is oversold or overbought, and some argued that divergences should be thought of at times of market consolidation rather than reversals. All of this work has been largely demonstrated with examples but little if any backtested proof. |
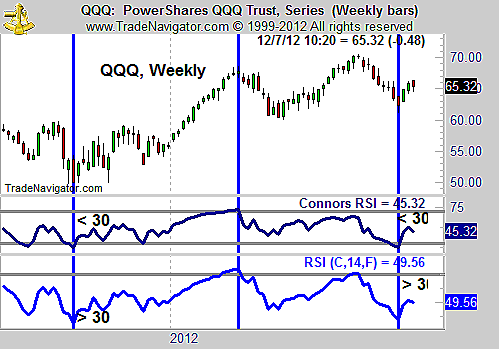
| Larry Connors identified the lack of backtesting as a weakness of technical analysis and he also identified a few weaknesses in RSI, which measures only price momentum. Connors added two additional variables to the calculation, which helped make it more accurate, and accuracy is defined not only as a matter of opinion but also with test results. The new version of RSI incorporates the length of the current price streak and the magnitude of recent price moves. Both versions of RSI are shown in Figure 1, with the ConnorsRSI in the center of the chart and the traditional calculation at the bottom. The calculation for ConnorsRSI is available at no cost at tradingmarkets.com. For an implementation in Trade Navigator, please email me. |

|
| FIGURE 1: QQQ, WEEKLY. ConnorsRSI becomes oversold and overbought more often than the traditional RSI. |
| Graphic provided by: Trade Navigator. |
| |
| ConnorsRSI became oversold twice in this example when traditional RSI did not. This chart is obviously the type of well-selected example that most analysts have used when they introduce an indicator or trading strategy. As impressive as the visual examples in charts can be, there is little excuse not to provide backtested data given the availability of both the software and data that is available to analysts. Connors has tested this indicator in various ways and found that it does an excellent job identifying times when the market is overbought or oversold. |
| Given the traditional levels for RSI (30 marking oversold and 70 being a sign of an overbought market), independent test data shows that ConnorsRSI is a better short-term trading tool. To test the two indicators, we can use the 30 stocks in the Dow Jones Industrial Average (DJIA) and simply buy when the indicator falls below 30 and sell short when the indicator rises above 70. In both tests, positions will be exited at the close five days after the trade is opened. ConnorsRSI delivers a significant edge in the test with 54.7% of trades being winners with an average gain of 0.24% while the traditional calculation shows 48.4% winners and an average five-day return of 0.09%. |

|
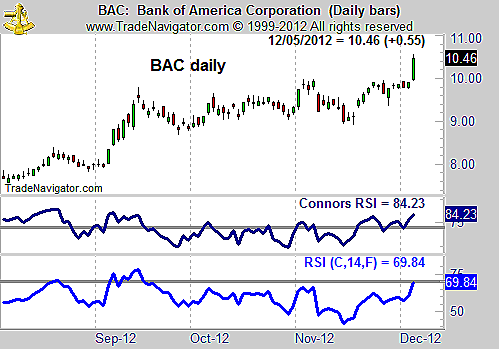
| FIGURE 2: BAC, DAILY. ConnorsRSI is indicating that BAC is due for a pullback while traditional RSI is not offering a signal. |
| Graphic provided by: Trade Navigator. |
| |
| Bank of America (BAC) is a sell now based on the ConnorsRSI. That indicator is showing BAC is ready for a pullback while traditional RSI is in neutral. In addition to this simple interpretation of the indicator, more complex strategies, such as waiting for a pullback after the ConnorsRSI reaches an extreme, deliver significantly better results. |
Mike Carr, CMT, is a member of the Market Technicians Association, and editor of the MTA's newsletter, Technically Speaking. He is also the author of "Smarter Investing in Any Economy: The Definitive Guide to Relative Strength Investing," and "Conquering the Divide: How to Use Economic Indicators to Catch Stock Market Trends."
| Website: | www.moneynews.com/blogs/MichaelCarr/id-73 |
| E-mail address: | marketstrategist@gmail.com |
Click here for more information about our publications!
Comments
Date: 12/12/12Rank: 4Comment:
Date: 12/12/12Rank: 1Comment: You should have provided the formular.
Date: 12/13/12Rank: 4Comment:
Date: 01/03/13Rank: 3Comment:
Date: 01/18/23Rank: 4Comment:

|

Request Information From Our Sponsors
- StockCharts.com, Inc.
- Candle Patterns
- Candlestick Charting Explained
- Intermarket Technical Analysis
- John Murphy on Chart Analysis
- John Murphy's Chart Pattern Recognition
- John Murphy's Market Message
- MurphyExplainsMarketAnalysis-Intermarket Analysis
- MurphyExplainsMarketAnalysis-Visual Analysis
- StockCharts.com
- Technical Analysis of the Financial Markets
- The Visual Investor
- VectorVest, Inc.
- Executive Premier Workshop
- One-Day Options Course
- OptionsPro
- Retirement Income Workshop
- Sure-Fire Trading Systems (VectorVest, Inc.)
- Trading as a Business Workshop
- VectorVest 7 EOD
- VectorVest 7 RealTime/IntraDay
- VectorVest AutoTester
- VectorVest Educational Services
- VectorVest OnLine
- VectorVest Options Analyzer
- VectorVest ProGraphics v6.0
- VectorVest ProTrader 7
- VectorVest RealTime Derby Tool
- VectorVest Simulator
- VectorVest Variator
- VectorVest Watchdog
