HOT TOPICS LIST
- MACD
- Fibonacci
- RSI
- Gann
- ADXR
- Stochastics
- Volume
- Triangles
- Futures
- Cycles
- Volatility
- ZIGZAG
- MESA
- Retracement
- Aroon
INDICATORS LIST
LIST OF TOPICS
PRINT THIS ARTICLE
by Koos van der Merwe
If you do not own an iPad, then you are showing your age.
Position: Buy
Koos van der Merwe
Has been a technical analyst since 1969, and has worked as a futures and options trader with First Financial Futures in Johannesburg, South Africa.
PRINT THIS ARTICLE
ELLIOTT WAVE
Taking Another Bite Out Of AAPL
12/12/12 08:36:11 AMby Koos van der Merwe
If you do not own an iPad, then you are showing your age.
Position: Buy
| I love my iPad, so much so that when the iPad Mini was introduced, I bought one, and it is always with me. I enjoy taking a photo with it and immediately emailing it to all my friends. I enjoy reading books with it, or following the market and even trading with it when I am on the road. I enjoy... that's probably enough. Can you imagine how many people are going to buy one as a Christmas present for a loved one? When I listen to CNBC state that Apple (AAPL) shares are now in bear market territory, because the share is below the 200-day moving average or because of the death cross (the 50-day moving average has fallen below the 200-day moving average) appearing, then I know it is time to buy. Am I correct in my assumption? Let us have a look. |

|
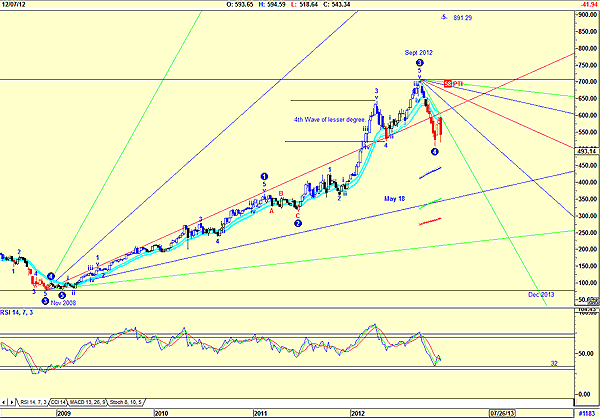
| FIGURE 1: AAPL, WEEKLY |
| Graphic provided by: AdvancedGET. |
| |
| Figure 1 is a weekly chart of AAPL showing an Elliott wave count that is suggesting that a wave 4 is now complete, and a wave 5 with a target of $891.29 is now a very real possibility. The count looks correct starting in November 2008 with wave 3 topping out in September 2012. The PTI (the probability index) is 58, which is very strong. The relative strength index (RSI) is close to suggesting a buy, strengthening the possibility of a rise, although it could drop below the 32 horizontal before a definite buy signal is confirmed. The Elliott wave count on the chart does show a solid wave 4, however, within the fourth wave of lesser degree, which lends further credence to the count. The two Gann fans are suggesting that the wave % top will be December 2013. The Gann fans are 90-degree fans from the low and the high. Where the fans cross the horizontal from the previous point a fan is drawn, suggesting a possible date as shown on the chart. |

|
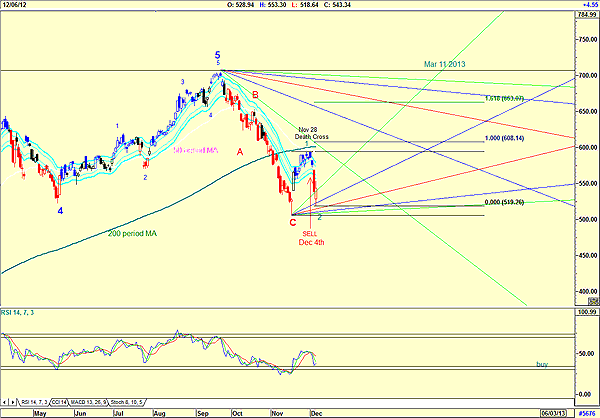
| FIGURE 2: AAPL, DAILY |
| Graphic provided by: AdvancedGET. |
| |
| The daily chart in Figure 2 confirms the fourth wave of the weekly chart with a wave 1 and the possible completion of a wave 2 of a wave 1 confirmed by the RSI, which is bullish. The share did give a JM internal band sell on December 4. The JM internal band indicator is a 15-period simple moving average offset by 2% positive and 2% negative. The death cross, where the 50-period moving average crossed below the 200-period moving average occurred on November 28, but with the RSI in buy mode, this signal was questioned. The share price did, however, fall as shown on the chart, but all signals point to a buying opportunity. Should the low of December 6 be real, then a Fibonacci extension is suggesting a wave 3 target of 663.07 (1.618). The Gann fans are suggesting a date of March 2013. I would be a buyer of AAPL shares at the present price. If the price is too expensive, then I would be a buyer of a call option expiring in July 2013. The amount of money I would spend on that call option would be the amount of money I would be prepared to lose on a stop-loss were I to buy the shares at the present price. Conservative investors could wait for the price to rise above the upper JM internal band line before buying. |
Has been a technical analyst since 1969, and has worked as a futures and options trader with First Financial Futures in Johannesburg, South Africa.
| Address: | 3256 West 24th Ave |
| Vancouver, BC | |
| Phone # for sales: | 6042634214 |
| E-mail address: | petroosp@gmail.com |
Click here for more information about our publications!
Comments
Date: 12/13/12Rank: 4Comment:

|

Request Information From Our Sponsors
- VectorVest, Inc.
- Executive Premier Workshop
- One-Day Options Course
- OptionsPro
- Retirement Income Workshop
- Sure-Fire Trading Systems (VectorVest, Inc.)
- Trading as a Business Workshop
- VectorVest 7 EOD
- VectorVest 7 RealTime/IntraDay
- VectorVest AutoTester
- VectorVest Educational Services
- VectorVest OnLine
- VectorVest Options Analyzer
- VectorVest ProGraphics v6.0
- VectorVest ProTrader 7
- VectorVest RealTime Derby Tool
- VectorVest Simulator
- VectorVest Variator
- VectorVest Watchdog
- StockCharts.com, Inc.
- Candle Patterns
- Candlestick Charting Explained
- Intermarket Technical Analysis
- John Murphy on Chart Analysis
- John Murphy's Chart Pattern Recognition
- John Murphy's Market Message
- MurphyExplainsMarketAnalysis-Intermarket Analysis
- MurphyExplainsMarketAnalysis-Visual Analysis
- StockCharts.com
- Technical Analysis of the Financial Markets
- The Visual Investor
