HOT TOPICS LIST
- MACD
- Fibonacci
- RSI
- Gann
- ADXR
- Stochastics
- Volume
- Triangles
- Futures
- Cycles
- Volatility
- ZIGZAG
- MESA
- Retracement
- Aroon
INDICATORS LIST
LIST OF TOPICS
PRINT THIS ARTICLE
by Chaitali Mohile
After a long time span, Alliant Techsystems has moved into a bullish zone. A few bearish indications are visible on the charts.
Position: N/A
Chaitali Mohile
Active trader in the Indian stock markets since 2003 and a full-time writer. Trading is largely based upon technical analysis.
PRINT THIS ARTICLE
BREAKOUTS
The Bullish Breakout Of Alliant Techsystems
12/11/12 09:14:00 AMby Chaitali Mohile
After a long time span, Alliant Techsystems has moved into a bullish zone. A few bearish indications are visible on the charts.
Position: N/A
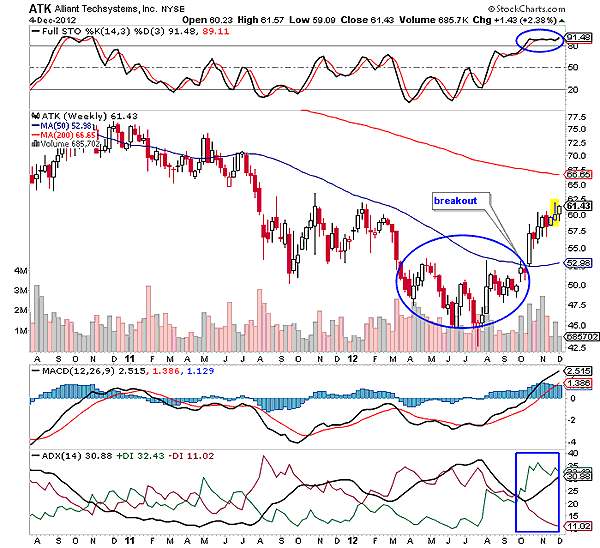
| Alliant Techsystems (ATK) was in a robust downtrend for the past two years. The 50-day moving average (MA) resistance dominated a bearish rally. During this phase, ATK witnessed strong bearish pressure, which forced the stock to form lower lows and lower highs. All the long red candlesticks in Figure 1 reflect bearish strength in the stock. Gradually, the stock formed a rounded bottom in 2012, indicating a halt for the declining rally. A rounded bottom is a bullish reversal pattern that gives birth to a fresh upward rally and a trend. A bullish breakout of the rounded pattern in Figure 1 was a major event for ATK as the robust 50-day MA resistance was converted to support. |
| The bullish breakout developed a fresh uptrend for the stock. The positive directional index (green line) surged above 20, indicating the new bullish trend in Figure 1. The full stochastic oscillator climbed the bullish zone, signifying fresh buying opportunity for traders. The moving average convergence/divergence (MACD) reflected bullish momentum by moving above the zero line. Thus, the breakout generated bullish sentiments in the stock. |

|
| FIGURE 1: ATK, WEEKLY |
| Graphic provided by: StockCharts.com. |
| |
| However, the 200-day moving average is the first resistance as well as an immediate target for the stock. Currently, the stock has moved much closer toward its target. Therefore, the rally is showing some reluctance. The candle marked in a yellow block in Figure 1 is a shooting star -- a bearish reversal candlestick pattern. This pattern suggests that the stock is likely to reverse -- that is, either move sideways or plunge a few points from the current level. However, the other oscillators in Figure 1 should also confirm the reversal. But the average directional index (ADX) (14) and the MACD (12,26,9) are not showing any signs of change in direction, and neither are they extremely bullish. The stochastic oscillator is the only indicator that has turned highly overbought, but it can sustain in this zone for a longer time. Hence, ATK is unlikely to undergo any drastic reversal action. The stock will slowly hit the 200-day MA resistance target in the long run. |

|
| FIGURE 2: ATK, DAILY |
| Graphic provided by: StockCharts.com. |
| |
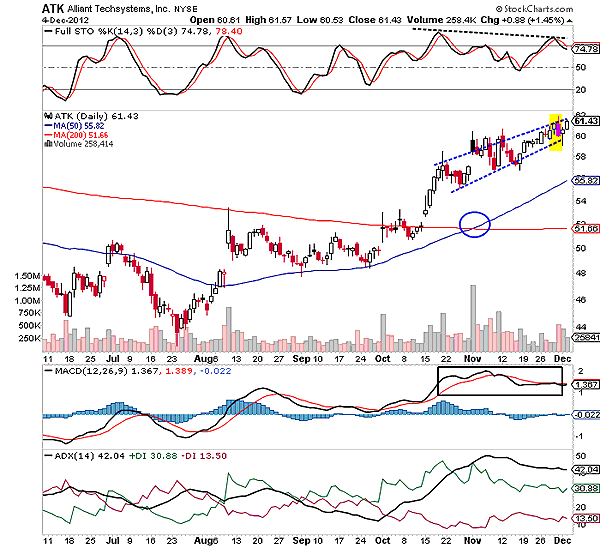
| On the daily time frame chart in Figure 2, ATK has formed a rising wedge -- a bearish reversal pattern. The price rally has formed a bearish engulfing pattern followed by a hanging man candlestick pattern at the top of the pattern. Both candlestick patterns initiate a downside rally. Therefore, the stock is ready to breach downward. The full stochastic (14,3,3) is showing a negative divergence, an uptrend is floating in an overheated region, and the MACD (12,26,9) is volatile. In this scenario, ATK would undergo a short-term downward rally. However, this intermediate rally would not harm the main uptrend of the stock. |
| To conclude, the bullish rally of ATK would witness marginal bearish pressure but will continue its journey toward the target. |
Active trader in the Indian stock markets since 2003 and a full-time writer. Trading is largely based upon technical analysis.
| Company: | Independent |
| Address: | C1/3 Parth Indraprasth Towers. Vastrapur |
| Ahmedabad, Guj 380015 | |
| E-mail address: | chaitalimohile@yahoo.co.in |
Traders' Resource Links | |
| Independent has not added any product or service information to TRADERS' RESOURCE. | |
Click here for more information about our publications!
PRINT THIS ARTICLE

Request Information From Our Sponsors
- StockCharts.com, Inc.
- Candle Patterns
- Candlestick Charting Explained
- Intermarket Technical Analysis
- John Murphy on Chart Analysis
- John Murphy's Chart Pattern Recognition
- John Murphy's Market Message
- MurphyExplainsMarketAnalysis-Intermarket Analysis
- MurphyExplainsMarketAnalysis-Visual Analysis
- StockCharts.com
- Technical Analysis of the Financial Markets
- The Visual Investor
- VectorVest, Inc.
- Executive Premier Workshop
- One-Day Options Course
- OptionsPro
- Retirement Income Workshop
- Sure-Fire Trading Systems (VectorVest, Inc.)
- Trading as a Business Workshop
- VectorVest 7 EOD
- VectorVest 7 RealTime/IntraDay
- VectorVest AutoTester
- VectorVest Educational Services
- VectorVest OnLine
- VectorVest Options Analyzer
- VectorVest ProGraphics v6.0
- VectorVest ProTrader 7
- VectorVest RealTime Derby Tool
- VectorVest Simulator
- VectorVest Variator
- VectorVest Watchdog
