HOT TOPICS LIST
- MACD
- Fibonacci
- RSI
- Gann
- ADXR
- Stochastics
- Volume
- Triangles
- Futures
- Cycles
- Volatility
- ZIGZAG
- MESA
- Retracement
- Aroon
INDICATORS LIST
LIST OF TOPICS
PRINT THIS ARTICLE
by Donald W. Pendergast, Jr.
With the .SPX still trading within a few percentage points of its post-crash highs, might the impending fiscal cliff be the triggering event prior to a major decline in the US stock indexes?
Position: N/A
Donald W. Pendergast, Jr.
Freelance financial markets writer and online publisher of the Trendzetterz.com S&P 500 Weekly Forecast service.
PRINT THIS ARTICLE
CYCLES
Is The Four-Year-Old Bull Run In .SPX Fading?
12/07/12 08:30:36 AMby Donald W. Pendergast, Jr.
With the .SPX still trading within a few percentage points of its post-crash highs, might the impending fiscal cliff be the triggering event prior to a major decline in the US stock indexes?
Position: N/A
| Who could have ever imagined, back in the seemingly hopeless stock market days of late February 2009, that the .SPX would finally make a major, enduring low prior to running up by more than 120% in the ensuing three and a half years? Few if any market technicians or fundamental analysts would have given the battered-down .SPX much hope of making it back above 1000, much less ever seeing the 1100, 1200, or even 1400 levels once again, and yet the market did eventually surge higher (in four identifiable waves), allowing some investors to recover a good portion of their 2007-09 losses -- if they weren't permanently scared off by the violent bear of the late 2000s, that is. All market scenarios eventually change, however, and 45 months after that mammoth bull run began, we now see evidence that the .SPX may be setting up for a major trend reversal, one that could take away as much as 38% to 50% of the gains it achieved during 2009-12. Here's a closer look now. |

|
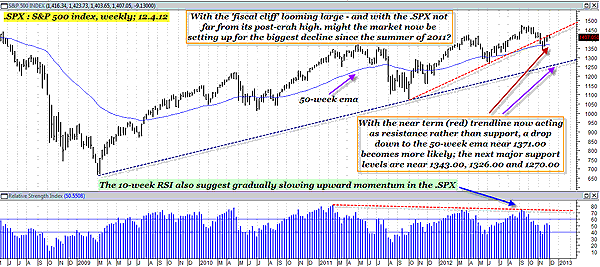
| FIGURE 1: SPX, WEEKLY. The .SPX's 10-week relative strength index (RSI) and trendlines suggest that a bearish pall has begun to overtake the index, some 45 months after its historic bull run commenced in March 2009. |
| Graphic provided by: MetaStock. |
| |
| Let's first look at the weekly chart of the .SPX (Figure 1), where we can clearly discern that the index has been gradually losing upward momentum, particularly during the last two upswings coming out of the August 2011 lows. This is very typical price action before a major turn lower in a market; also note that the red uptrend line from the August 2011 lows has already been broken and is now acting as de facto resistance -- yet another bearish warning of an impending decline. The .SPX is trading just a bit above its 50-week exponential moving average (EMA)(blue line) and if you see this broken on a weekly close, the odds favor much more rapid downside, with the next support levels coming in at 1343, 1326, and 1270. The fiscal cliff issue is a real wild card to add into this bearish technical mix; with people so fed up with such long-term mismanagement of the nation's finances (the last year of a balanced Federal budget was in 1969, believe it or not), it might not take too much more political bungling in Washington DC to trigger a truly nasty market selloff going into 2013. |

|
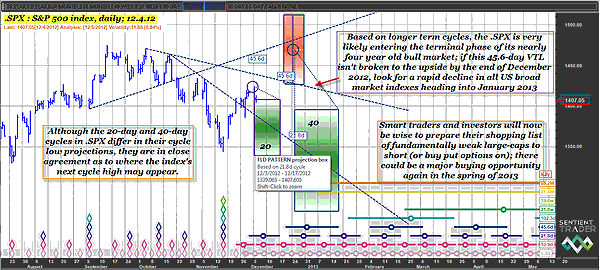
| FIGURE 2: SPX, DAILY. The probabilities favor more downside price action in the .SPX through late December, with even bigger declines arriving by March-May 2013. A break higher into the lower portion of the red time/price zone before the last week of December 2012 is still a possibility, however. |
| Graphic provided by: Sentient Trader. |
| |
| As we look at the near-term price cycle action in the .SPX, we also find that its 20-and 40-day cycles (Figure 2) are also projecting lows down to as much as 1270, sometime between now and January 2013. Longer-term cycles (80-day and 20-week) are also projecting even lower prices into March-May 2013. There is a slight possibility that the index can rally into the red shaded time/price projection box by late December 2012, but that is only likely if the downsloping 45.6-day valid trendline (VTL) is broken before Christmas Eve 2012; don't bank on this happening, but it is always a possibility. |
| At this moment, savvy traders need to be scanning their large-cap stock databases for the following criteria: 1. Negative earnings growth or earnings misses 2. Poor four- and 13-week relative strength rankings versus the .SPX and/or .NDX 3. Mechanical short-sale signals for such stocks in the time frame that you normally trade. With the potential for substantial market declines in the first half of 2013, traders might want to focus on daily and weekly based trading signals, using the simple criteria shown here. Trailing stops and profit targets for such short trades should (as always) be based on your risk tolerance and meaningful chart and/or Fibonacci support levels. Risking 2% or less on your trades can help give your equity account the staying power it needs to help you become the successful trader you desire to become. Trade wisely until we meet here again. |
Freelance financial markets writer and online publisher of the Trendzetterz.com S&P 500 Weekly Forecast service.
| Title: | Market consultant and writer |
| Company: | Trendzetterz |
| Address: | 81 Hickory Hollow Drive |
| Crossville, TN 38555 | |
| Phone # for sales: | 904-303-4814 |
| Website: | trendzetterz.com |
| E-mail address: | support@trendzetterz.com |
Traders' Resource Links | |
| Trendzetterz has not added any product or service information to TRADERS' RESOURCE. | |
Click here for more information about our publications!
PRINT THIS ARTICLE

Request Information From Our Sponsors
- StockCharts.com, Inc.
- Candle Patterns
- Candlestick Charting Explained
- Intermarket Technical Analysis
- John Murphy on Chart Analysis
- John Murphy's Chart Pattern Recognition
- John Murphy's Market Message
- MurphyExplainsMarketAnalysis-Intermarket Analysis
- MurphyExplainsMarketAnalysis-Visual Analysis
- StockCharts.com
- Technical Analysis of the Financial Markets
- The Visual Investor
- VectorVest, Inc.
- Executive Premier Workshop
- One-Day Options Course
- OptionsPro
- Retirement Income Workshop
- Sure-Fire Trading Systems (VectorVest, Inc.)
- Trading as a Business Workshop
- VectorVest 7 EOD
- VectorVest 7 RealTime/IntraDay
- VectorVest AutoTester
- VectorVest Educational Services
- VectorVest OnLine
- VectorVest Options Analyzer
- VectorVest ProGraphics v6.0
- VectorVest ProTrader 7
- VectorVest RealTime Derby Tool
- VectorVest Simulator
- VectorVest Variator
- VectorVest Watchdog
