HOT TOPICS LIST
- MACD
- Fibonacci
- RSI
- Gann
- ADXR
- Stochastics
- Volume
- Triangles
- Futures
- Cycles
- Volatility
- ZIGZAG
- MESA
- Retracement
- Aroon
INDICATORS LIST
LIST OF TOPICS
PRINT THIS ARTICLE
by Gary Grosschadl
Many gold traders are perplexed by the apparent sluggish action of gold lately relative to the diving main indices.
Position: N/A
Gary Grosschadl
Independent Canadian equities trader and technical analyst based in Peterborough
Ontario, Canada.
PRINT THIS ARTICLE
GOLD & METALS
Gold's Bullish Short-Term Flags Explain Gold Confusion
07/22/02 01:25:02 PMby Gary Grosschadl
Many gold traders are perplexed by the apparent sluggish action of gold lately relative to the diving main indices.
Position: N/A
| Last week I showed a view of the bigger picture gold with a longer term bearish rising wedge formation failure and pending pullback test. In a shorter time frame I can make bullish arguments via the following flag formations for $XAU and gold price. Both views can be correct in the overall scheme of things. A bullish flag breakout may set up a future pullback failure on that rising wedge formation for the price of gold. |
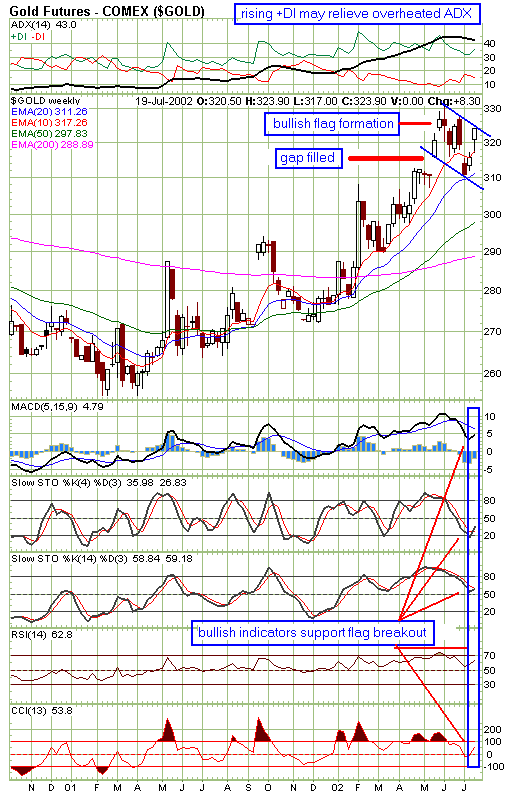
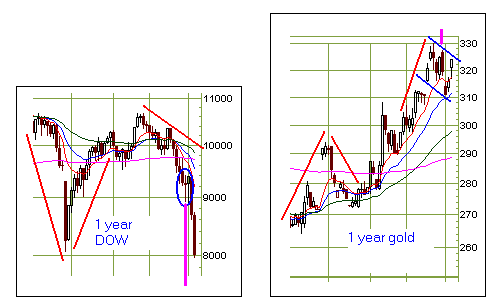
| The Comex gold chart below shows what happened after gold's dramatic pop from $310 to $330. Confusion followed when gold traders anticipated further bullish followthrough as the market's main indices continued to degrade. Instead gold price and $XAU index backed off in a bearish fashion. However as this bullish flag formation shows, this may only be a temporary anomaly. So you might muse why this happened. I see two factors behind this flag formation. First, as the chart hints, gold prices got a little ahead of themselves in this short-term and traders decided on some prudent profit taking. This led to the filling of the previous gap and set up a test of the 20-day EMA support, something traders may have been correctly interpreting. The other factor was the action of the main indices. The Dow for instance, possibly fooled traders into thinking there was a powerful reversal building at 9000 especially when candle formations hinted at a possible bottom hammer. This failed and should not have been a big surprise as volume was just not convincing enough -- it did not exceed recent previous volume. As Figure 2 shows, comparing one-year weekly gold to the Dow, gold price balked just as the Dow looked like it could rally from 9000. |

|
| Figure 1: Comex weekly gold chart. |
| Graphic provided by: StockCharts.com. |
| |
 Figure 2: One year Dow compared to 1-year gold prices. My theory is that gold players were spooked when it looked like the Dow would do a major bounce from 9000. This caused the price of gold to hesitate into a BULLISH flag formation. Now the prudent traders would wait for the outcome of these flags either way. One cautionary note going forward -- be alert for the possibility of a double top failure close to $330 gold as this could be another profit taking hurdle. |
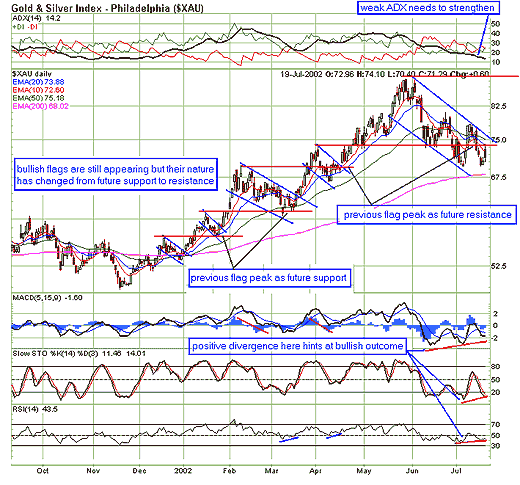
 Figure 3: Daily chart of the Philadelphia Gold and Silver Index ($XAU). The weekly chart for XAU also shows a bullish flag formation similar to the previous chart, but I chose to show the daily chart as the pattern is interesting. It shows a continuation pattern of multiple bullish flags but note the "change of nature" hinting at a slowing or future topping action as the power of these flag supports appears to be diminishing. |
| It would be reasonable to conjecture that gold will make a upside break from its bullish flag if main indices continue to suffer, likewise a surprise rally here for the main indices could lead to early gold failure. In the bigger picture success or failure will also be reflected in the outcome of the rising bearish wedge as depicted in a previous article entitled "Gold's Bearish Rising Wedge and The London Gold Fix." My opinion remains as before though -- I would be surprised to see gold make a move past a brief spike $340 - 350. But as always the market remains the boss and we have to be patient enough to wait for the market to tell us what is happenning and then act accordingly. |
Independent Canadian equities trader and technical analyst based in Peterborough
Ontario, Canada.
| Website: | www.whatsonsale.ca/financial.html |
| E-mail address: | gwg7@sympatico.ca |
Click here for more information about our publications!
Comments
Date: 07/23/02Rank: 5Comment:

|

Request Information From Our Sponsors
- VectorVest, Inc.
- Executive Premier Workshop
- One-Day Options Course
- OptionsPro
- Retirement Income Workshop
- Sure-Fire Trading Systems (VectorVest, Inc.)
- Trading as a Business Workshop
- VectorVest 7 EOD
- VectorVest 7 RealTime/IntraDay
- VectorVest AutoTester
- VectorVest Educational Services
- VectorVest OnLine
- VectorVest Options Analyzer
- VectorVest ProGraphics v6.0
- VectorVest ProTrader 7
- VectorVest RealTime Derby Tool
- VectorVest Simulator
- VectorVest Variator
- VectorVest Watchdog
- StockCharts.com, Inc.
- Candle Patterns
- Candlestick Charting Explained
- Intermarket Technical Analysis
- John Murphy on Chart Analysis
- John Murphy's Chart Pattern Recognition
- John Murphy's Market Message
- MurphyExplainsMarketAnalysis-Intermarket Analysis
- MurphyExplainsMarketAnalysis-Visual Analysis
- StockCharts.com
- Technical Analysis of the Financial Markets
- The Visual Investor
