HOT TOPICS LIST
- MACD
- Fibonacci
- RSI
- Gann
- ADXR
- Stochastics
- Volume
- Triangles
- Futures
- Cycles
- Volatility
- ZIGZAG
- MESA
- Retracement
- Aroon
INDICATORS LIST
LIST OF TOPICS
PRINT THIS ARTICLE
by Koos van der Merwe
Here are two shares that were way up there and are now way down there.
Position: Sell
Koos van der Merwe
Has been a technical analyst since 1969, and has worked as a futures and options trader with First Financial Futures in Johannesburg, South Africa.
PRINT THIS ARTICLE
MA ENVELOPES
Looking At Two That Were Way Up There Once
12/05/12 08:41:21 AMby Koos van der Merwe
Here are two shares that were way up there and are now way down there.
Position: Sell
| Many shares were on top of the heap before they dropped. The first that comes to mind is Nortel on the Canadian market, a share that was once $70 a share, and today no longer exists. A second share is Kodak, which went into bankruptcy and today is listed on the over-the-counter market valued at 19.7 cents a share. So when two companies that were on top of the heap collapse, is it worth buying the shares, hoping for a recovery? The shares I am writing about are Research in Motion Ltd. (RIM) and Hewlett Packard Co. (HPQ). |

|
| FIGURE 1: RIM, DAILY |
| Graphic provided by: AdvancedGET. |
| |
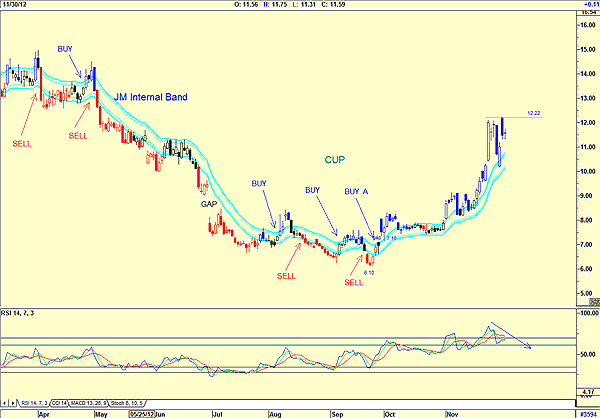
| Figure 1 is a daily chart of RIM. The chart shows the buy and sell signals of the JM internal band, a 15-period simple moving average offset by 2% positive and 2% negative. The number of failed buy signals would make us cautious when a buy occurred. However, the fact that the buy signal happened on a gap could have given a more positive outlook. The price of the share at this signal was $7.10 and with a price at $11.59, it would have been a good buy. The chart also shows that a cup & handle formation is developing, suggesting that should the price break above the $12.22 level, it could rise to test the $18.34 target (12.22 - 6.10 = 6.12 + 12.22 = 18.34). With the relative strength index (RSI) suggesting weakness, the handle may take some time to develop fully and move above $12.22. The stock, however, bears watching. |

|
| FIGURE 2: HPQ, DAILY |
| Graphic provided by: AdvancedGET. |
| |
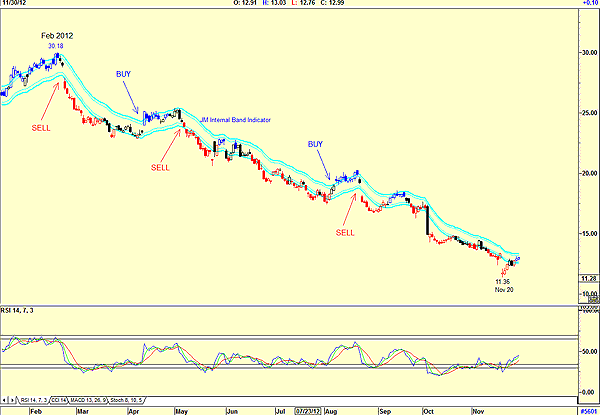
| Figure 2 is Hewlett Packard. The chart shows the buy & sell signals given by the JM internal band indicator from February 2012 when the price of the share was $30.18 to its present price of $11.36, all of which were buy failures. Short sellers, however, would have laughed all the way to the bank. The chart shows the failure of the RSI to give a buy signal. The share price of RIM deserves watching, but the share price of Hewlett Packard looks pretty dismal. Can either company go the way of Nortel and Kodak? Of course, any company can follow them into oblivion. We just hope that these two companies do not. However, RIM does look to be in a better position than HPQ. |
Has been a technical analyst since 1969, and has worked as a futures and options trader with First Financial Futures in Johannesburg, South Africa.
| Address: | 3256 West 24th Ave |
| Vancouver, BC | |
| Phone # for sales: | 6042634214 |
| E-mail address: | petroosp@gmail.com |
Click here for more information about our publications!
PRINT THIS ARTICLE

Request Information From Our Sponsors
- VectorVest, Inc.
- Executive Premier Workshop
- One-Day Options Course
- OptionsPro
- Retirement Income Workshop
- Sure-Fire Trading Systems (VectorVest, Inc.)
- Trading as a Business Workshop
- VectorVest 7 EOD
- VectorVest 7 RealTime/IntraDay
- VectorVest AutoTester
- VectorVest Educational Services
- VectorVest OnLine
- VectorVest Options Analyzer
- VectorVest ProGraphics v6.0
- VectorVest ProTrader 7
- VectorVest RealTime Derby Tool
- VectorVest Simulator
- VectorVest Variator
- VectorVest Watchdog
- StockCharts.com, Inc.
- Candle Patterns
- Candlestick Charting Explained
- Intermarket Technical Analysis
- John Murphy on Chart Analysis
- John Murphy's Chart Pattern Recognition
- John Murphy's Market Message
- MurphyExplainsMarketAnalysis-Intermarket Analysis
- MurphyExplainsMarketAnalysis-Visual Analysis
- StockCharts.com
- Technical Analysis of the Financial Markets
- The Visual Investor
