HOT TOPICS LIST
- MACD
- Fibonacci
- RSI
- Gann
- ADXR
- Stochastics
- Volume
- Triangles
- Futures
- Cycles
- Volatility
- ZIGZAG
- MESA
- Retracement
- Aroon
INDICATORS LIST
LIST OF TOPICS
PRINT THIS ARTICLE
by Donald W. Pendergast, Jr.
Shares of Newpark Resources have enjoyed a strong rally since late June 2012, with more gains likely into mid-December 2012.
Position: N/A
Donald W. Pendergast, Jr.
Freelance financial markets writer and online publisher of the Trendzetterz.com S&P 500 Weekly Forecast service.
PRINT THIS ARTICLE
CYCLES
Newpark Resources Charging Higher Into Year-End 2012
12/05/12 08:21:59 AMby Donald W. Pendergast, Jr.
Shares of Newpark Resources have enjoyed a strong rally since late June 2012, with more gains likely into mid-December 2012.
Position: N/A
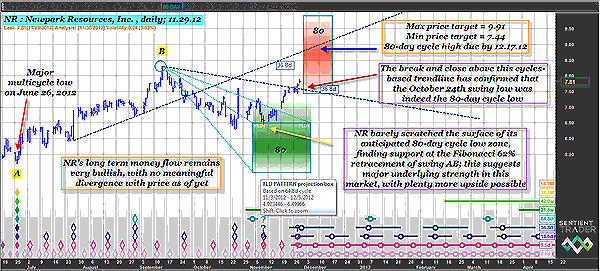
| Like many other energy sector stocks, Newpark Resources (NR) completed a major multicycle low on June 26, 2012; NR bottomed at 5.19 and proceeded to rally strongly for the next 11 weeks, finally topping out at 8.31 on September 14, 2012 -- a gain of more than 60%. Now, after experiencing a 62% pullback (to 6.29 on October 24, 2012) of that powerful bullish run, NR is charging higher once again. Is this multistage rally getting long in the tooth, or can NR continue to outperform, eventually taking out the prior high of 8.31 by year-end 2012? Here's a closer look now (Figure 1). |

|
| FIGURE 1: NR, DAILY. NR's underlying strength coming out of its June 2012 multicycle low was confirmed when the stock just barely descended into its projected 80-day cycle low and then rocketed higher again. |
| Graphic provided by: Sentient Trader. |
| |
| Running the Deel Momentum Filter exploration in MetaStock 11 revealed that only Newpark Resources (NR) was the only stock in the oil services industry group with outstanding bullish momentum characteristics, and when the stock's cyclical activity was analyzed in Sentient Trader, it was easy to see just how strong the stock truly is. Note that the major swing up from June 26 is labeled with an A at the low and a B at its peak; NR retraced a full 62% of swing AB -- within the time/price window already projected for its next 80-day cycle low -- and then took off once again after a minor retest of support (late October-early November 2012). The stock's long-term money flow remains very bullish and has in fact been confirming that the smart money interests in this equity have been accumulating more of it since May-June 2012. This is all very bullish for NR, of course, and the stock's recent close above the downsloping trendline (the 36.8-day valid trendline) has also provided conclusive evidence that its October-November low was of an 80-day cycle magnitude and that the stock should have little if any trouble powering up into its red time/price projection zone, which is its next anticipated 80-day cycle high zone. |

|
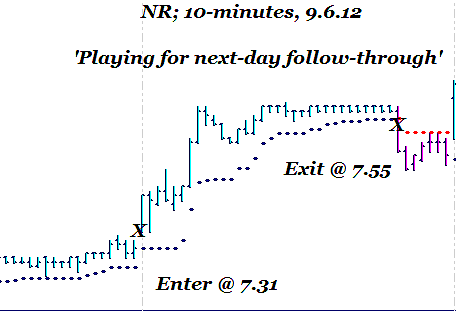
| FIGURE 2: NR, 10 MINUTE. After NR's daily eight-bar RSI closed above 60 on September 5, 2012, the stock proceeded to rally once again. This hypothetical long trade netted nearly 3.3% during the next trading session. |
| Graphic provided by: TradeStation. |
| Graphic provided by: Trading Alchemy Trend Catcher. |
| |
| As far as playing NR on the bullish side now, it's a bit too risky to take a large long position, as the stock has already made substantial gains in the last few weeks. However, for those skilled in intraday trading, here's a trading idea you may not have considered before, one that has low risk and a good probability of gain: 1. Since NR has such powerful bullish momentum, plot an eight-day relative strength index (RSI) on its daily chart, setting the overbought/oversold levels to 60/40. Wait for NR to pull back enough for the RSI to drop below 60, making sure that the pullback is at least three bars in length. 2. If NR climbs again, with its eight-bar RSI closing above 60, enter your full position of shares on a break above the high of the price bar that caused the RSI to close above 60. To trade this setup intraday, make sure you are running a recent edition of TradeStation and the Trading Alchemy Trend Catcher indicator (set to eight-periods, using a factor of 2.382). 3. Once filled, simply use the Trend Catcher as your trailing stop, running your full position until you have an intraday close below the trailing stop. On September 6, 2012, such a simple momentum entry method would have gone something like this (see Figure 2): * Enter 500 shares of NR at 7.31 at 930 ET * Initial stop of 7.26 placed at time of entry * Exit 500 shares of NR at 7.55 at 1451 ET The initial risk on the trade was $0.05 or $25 before commissions and slippage. Bear in mind that this is an aggressive intraday momentum follow-through entry, hence the close stop. The hypothetical trade netted $0.24 or $120 before commissions and slippage; not every trade works this well, but if you find high momentum, high relative strength stocks on your daily chart scans, then your job of playing for next-day follow-through becomes relatively easy. Scanning a database of high-quality, high-momentum stocks at the end of each trading session should give you plenty of stocks that you can learn to trade for steady intraday profits, using a system similar to the one just described. Keep your risks small on these kinds of momentum trades -- preferably less than 1% of your account equity -- and, as always, trade wisely until we meet here again. |
Freelance financial markets writer and online publisher of the Trendzetterz.com S&P 500 Weekly Forecast service.
| Title: | Market consultant and writer |
| Company: | Trendzetterz |
| Address: | 81 Hickory Hollow Drive |
| Crossville, TN 38555 | |
| Phone # for sales: | 904-303-4814 |
| Website: | trendzetterz.com |
| E-mail address: | support@trendzetterz.com |
Traders' Resource Links | |
| Trendzetterz has not added any product or service information to TRADERS' RESOURCE. | |
Click here for more information about our publications!
Comments
Date: 12/07/12Rank: 3Comment:

Request Information From Our Sponsors
- StockCharts.com, Inc.
- Candle Patterns
- Candlestick Charting Explained
- Intermarket Technical Analysis
- John Murphy on Chart Analysis
- John Murphy's Chart Pattern Recognition
- John Murphy's Market Message
- MurphyExplainsMarketAnalysis-Intermarket Analysis
- MurphyExplainsMarketAnalysis-Visual Analysis
- StockCharts.com
- Technical Analysis of the Financial Markets
- The Visual Investor
- VectorVest, Inc.
- Executive Premier Workshop
- One-Day Options Course
- OptionsPro
- Retirement Income Workshop
- Sure-Fire Trading Systems (VectorVest, Inc.)
- Trading as a Business Workshop
- VectorVest 7 EOD
- VectorVest 7 RealTime/IntraDay
- VectorVest AutoTester
- VectorVest Educational Services
- VectorVest OnLine
- VectorVest Options Analyzer
- VectorVest ProGraphics v6.0
- VectorVest ProTrader 7
- VectorVest RealTime Derby Tool
- VectorVest Simulator
- VectorVest Variator
- VectorVest Watchdog
