HOT TOPICS LIST
- MACD
- Fibonacci
- RSI
- Gann
- ADXR
- Stochastics
- Volume
- Triangles
- Futures
- Cycles
- Volatility
- ZIGZAG
- MESA
- Retracement
- Aroon
INDICATORS LIST
LIST OF TOPICS
PRINT THIS ARTICLE
by David Penn
Natural gas broke down from a head and shoulders top in July. Will other energy futures follow suit?
Position: N/A
David Penn
Technical Writer for Technical Analysis of STOCKS & COMMODITIES magazine, Working-Money.com, and Traders.com Advantage.
PRINT THIS ARTICLE
HEAD & SHOULDERS
Petroleum's Head and Shoulders Complex
07/24/02 01:14:10 PMby David Penn
Natural gas broke down from a head and shoulders top in July. Will other energy futures follow suit?
Position: N/A
| Petroleum futures exploded in the spring. As measured by the September contracts' breakouts in March, heating oil is up over 24%, unleaded gas up over 28%, and crude oil is up over 28%. These are the sorts of moves that can make a futures trader's year (all were easily $4,000 per contract opportunities). Now, however, all three of these futures have shown strong signs of developing tops, head and shoulders tops, to be specific. Those traders who profited from the ride up in petroleum futures (and the many more who unfortunately did not), should now switch their attentions to the likelihood of a ride down. |
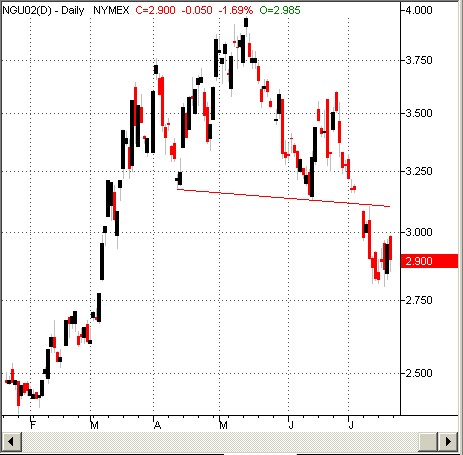
| Natural gas futures may show the way. Natural gas futures, as measured by the September contracts, also rocketed upward in March also and, as the upward momentum subsided, these futures also developed head and shoulders tops, with peaks in early April, mid-May, and late June. Unlike the petroleum futures, however, natural gas futures fell swiftly after making their late June peak just north of 3.500. Breaking down beneath support (the head and shoulders "neckline") just south of 3.250, natural gas futures fell to a low of 2.810 in mid-July. Given the size of the head and shoulders top in September natural gas, however, there could be more declines to come. The downside target for NGU02 remains 2.320, nearly another 500 points and $4,000 away. |

|
| Figure 1: This head and shoulders top has only begun to break down the natural gas futures. |
| Graphic provided by: TradeStation. |
| |
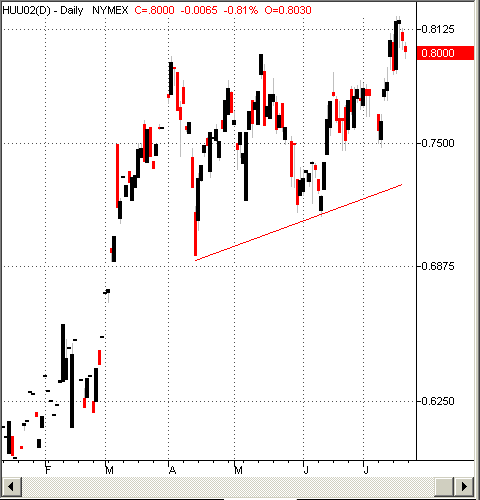
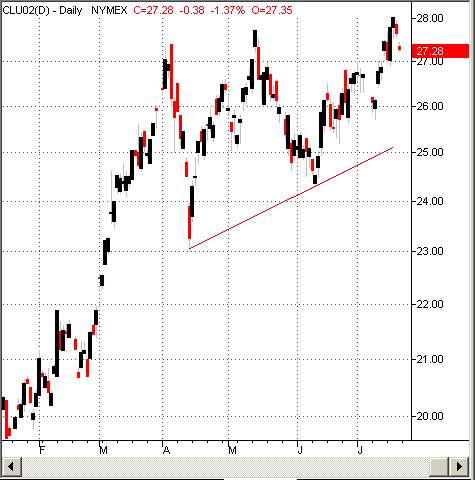
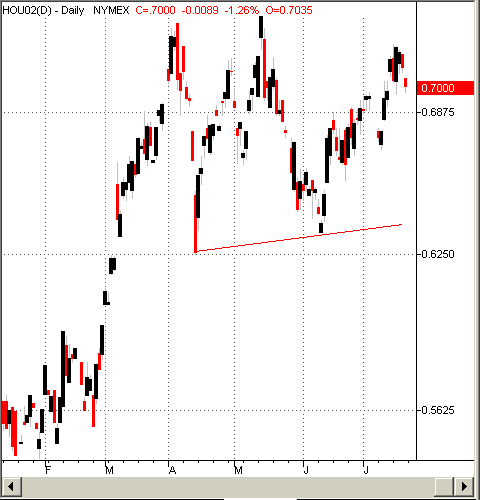
| The petroleum futures -- heating oil, unleaded gas and crude oil -- have yet to break. With virtually identical head and shoulders tops, the petroleum futures looked as if they might make a final peak in late June (as the natural gas futures did). However, the corrections from the third peaks (see charts below) all found support early in July and began to reverse. In the cases of unleaded gas and crude oil, this reversal has led to a third peak that is even higher than the central peak (the "head" in the head and shoulders formation). While this is somewhat unusual, it does not necessarily invalidate the possibility of a head and shoulders top, complete with downside break. But it does suggest that volatility with the petroleum futures is such that unexpected moves should probably be watched for -- and that a short trade in any of these futures contracts should be entered with extreme caution. |
  Figure 2: Instead of breaking down in June, both unleaded gas and crude oil rallied, setting new contract highs in July. While the possibility of a set of head and shoulders top failures currently looms a bit larger than the likelihood of these petroleum futures breaking down, it is nonetheless worthwhile to get a sense of where a successful head and shoulders breakdown might take the price of petroleum futures. Looking first at the September heating oil contract (which has not yet taken out the contract high), a successful breakdown could take September heating oil to as low as .5280. Similar breakdowns for successful head and shoulders tops in unleaded gas and crude oil would likely take these futures to as low as .5805 and 18.16, respectively. It is also worth mentioning that both of these numbers would represent significant contract lows.  Figure 3: No new contract high in heating oil helps keep hope alive for a downside breakout from this head and shoulders top. |
| A note on the U.S. dollar and energy futures . . . Successful head and shoulders tops in energy futures -- from natural gas to crude oil -- would be the strongest indication of a possible rally in the US dollar. Although they do not correspond perfectly, the US dollar began moving down in February 2002, just as the energy futures were beginning their sizable rallies. The energy futures appear to have topped during the period when the greenback was falling most precipitously which suggests that if there is an inverse relationship to be seen between the greenback and energy futures in the first half of 2002, that relationship also features a bit of a lag. The idea of a generally inverse relationship between the greenback and energy futures is not unique -- "low energy prices" have often been credited for helping both the economy and the stock market grow and advance. |
Technical Writer for Technical Analysis of STOCKS & COMMODITIES magazine, Working-Money.com, and Traders.com Advantage.
| Title: | Technical Writer |
| Company: | Technical Analysis, Inc. |
| Address: | 4757 California Avenue SW |
| Seattle, WA 98116 | |
| Phone # for sales: | 206 938 0570 |
| Fax: | 206 938 1307 |
| Website: | www.Traders.com |
| E-mail address: | DPenn@traders.com |
Traders' Resource Links | |
| Charting the Stock Market: The Wyckoff Method -- Books | |
| Working-Money.com -- Online Trading Services | |
| Traders.com Advantage -- Online Trading Services | |
| Technical Analysis of Stocks & Commodities -- Publications and Newsletters | |
| Working Money, at Working-Money.com -- Publications and Newsletters | |
| Traders.com Advantage -- Publications and Newsletters | |
| Professional Traders Starter Kit -- Software | |
Click here for more information about our publications!
PRINT THIS ARTICLE

Request Information From Our Sponsors
- StockCharts.com, Inc.
- Candle Patterns
- Candlestick Charting Explained
- Intermarket Technical Analysis
- John Murphy on Chart Analysis
- John Murphy's Chart Pattern Recognition
- John Murphy's Market Message
- MurphyExplainsMarketAnalysis-Intermarket Analysis
- MurphyExplainsMarketAnalysis-Visual Analysis
- StockCharts.com
- Technical Analysis of the Financial Markets
- The Visual Investor
- VectorVest, Inc.
- Executive Premier Workshop
- One-Day Options Course
- OptionsPro
- Retirement Income Workshop
- Sure-Fire Trading Systems (VectorVest, Inc.)
- Trading as a Business Workshop
- VectorVest 7 EOD
- VectorVest 7 RealTime/IntraDay
- VectorVest AutoTester
- VectorVest Educational Services
- VectorVest OnLine
- VectorVest Options Analyzer
- VectorVest ProGraphics v6.0
- VectorVest ProTrader 7
- VectorVest RealTime Derby Tool
- VectorVest Simulator
- VectorVest Variator
- VectorVest Watchdog
