HOT TOPICS LIST
- MACD
- Fibonacci
- RSI
- Gann
- ADXR
- Stochastics
- Volume
- Triangles
- Futures
- Cycles
- Volatility
- ZIGZAG
- MESA
- Retracement
- Aroon
INDICATORS LIST
LIST OF TOPICS
PRINT THIS ARTICLE
by Donald W. Pendergast, Jr.
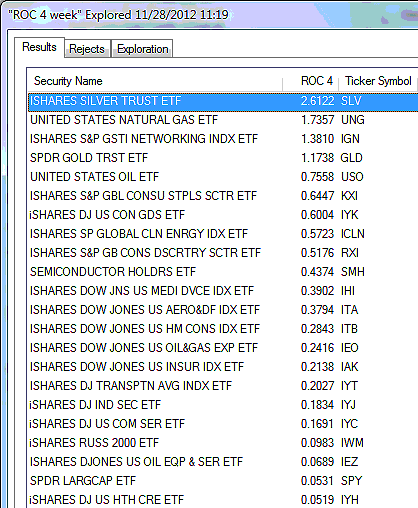
The iShares Silver Trust has been very strong since early November, easily outperforming most other exchange traded funds (ETFs) in the past four weeks.
Position: N/A
Donald W. Pendergast, Jr.
Freelance financial markets writer and online publisher of the Trendzetterz.com S&P 500 Weekly Forecast service.
PRINT THIS ARTICLE
REL. STR COMPARATIVE
SLV Outperforming Among ETFs
12/03/12 11:34:43 AMby Donald W. Pendergast, Jr.
The iShares Silver Trust has been very strong since early November, easily outperforming most other exchange traded funds (ETFs) in the past four weeks.
Position: N/A
| When the silver market is hot, it's hot, and when it's not, it's not. This volatile commodity market can now be traded just like a stock, without the need to ship, hold, or store actual metal or take on the extreme risk of trading futures contracts. The iShares Silver Trust (SLV) is the exchange traded fund created for equity market participants who want and/or need a more convenient, potentially less risky trading vehicle that can help them achieve their trading and investing goals. Here's a look at a unique, nondiscretionary timing template for trading SLV on a daily time frame, one that can easily be adapted to suit your own trading biases. |

|
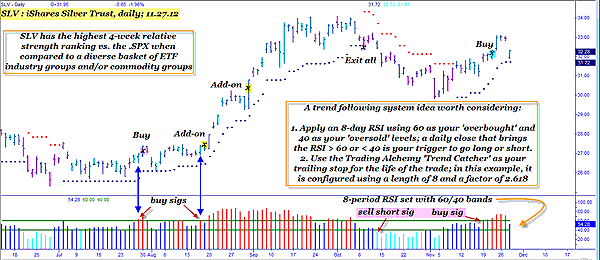
| FIGURE 1: SLV, DAILY. This may not be the world's ultimate trading system, but it's a solid foundation to build upon, especially for newer traders. |
| Graphic provided by: TradeStation. |
| Graphic provided by: Trading Alchemy Trend Catcher. |
| |
| If you like the idea of trading a daily bar-based trend-following model using SLV, here's a simple and adaptable trading template that you can easily set up in TradeStation. Figure 1, a daily chart of SLV, is overlaid with the Trading Alchemy Trend Catcher (TC) indicator. The lookback is set at eight bars and the factor is dialed in at 2.618 and it functions similar to a volatility-based trailing stop. When the TC identifies a meaningful shift in trend from bearish to bullish (or bullish to bearish), the price bars will automatically change from purple to teal (or vice versa), informing users that a swing or trending move may be about to get under way. This seems to work okay with the input settings described, but after doing a bit of testing, this writer has found that including the use of an eight-period relative strength index (RSI) with its overbought/oversold bands set to 60/40 and using breaks above 60 as buy triggers and declines below 40 as sell triggers provides more timely entry signals, especially when used with the TC. The chart shows how an initial buy signal was triggered on July 27, 2012, when the RSI made a daily close above 60; another add-on buy signal was triggered on August 16, 2012 after the eight-period RSI: 1. Closed above 60 again, and 2. At a higher price that the original buy signal, and 3. SLV was still above the teal TC trailing stop. With all three of these conditions met, adding on to the original position was a relatively low risk proposition. Another add-on opportunity occurred on August 31, 2012, when SLV: 1. Broke above a significant prior swing high, and 2. The RSI never declined below 60 on the prior pullback, and 3. SLV was still above the teal TC trailing stop. Now, of course, the trader still needs to decide before the initial entry: 1. How much account equity % to risk on the original entry 2. How much account equity % to risk on add-on entries 3. Whether to set partial profit targets for each particular entry or to trail all positions with the TC, exiting all of them in one single trade. These are important considerations and they are actually more important than the entry trigger rules already given, so be sure you always know your unique trading temperament and risk parameters for every trade setup when using this or any other trading methodology. |

|
| FIGURE 2: SPX VS. ETFS. The iShares Silver Trust is easily outperforming the .SPX versus other key exchange traded funds over the past four weeks. |
| Graphic provided by: MetaStock. |
| Graphic provided by: MetaStock Explorer. |
| |
| The trade ultimately evolved into a big winner, finally stopping out all positions on October 9, 2012 (note that's when the teal TC trailing stop was penetrated). A new short trigger bar appeared on October 12, 2012, when the daily RSI closed below 40; if you look closely you can see that there were two minor add-on opportunities on this short trade as well, and that it would have returned a modest profit when all positions were stopped out on November 9, 2012. Currently, SLV is in a new long position, one initiated after the RSI closed above 60 on November 19, 2012; SLV remains above its teal TC trailing stop and may actually have begun to stage a sharp bullish intraday reversal after testing the TC trailing stop/support level. Note that for any add-on buy signal to occur, the exact same rules for add-ons (previously mentioned) need to be met. See Figure 2. |
| Your job now is to see if you can improve upon this well-thought-out trading method and apply it to the individual stocks and ETFs you regularly trade, paying particular attention to your position sizing and account risk parameters. You'll also need the Trading Alchemy Trend Catcher and related indicators and also need to be running a recent edition TradeStation on your computer to get going with this. Trade wisely until we meet here again. |
Freelance financial markets writer and online publisher of the Trendzetterz.com S&P 500 Weekly Forecast service.
| Title: | Market consultant and writer |
| Company: | Trendzetterz |
| Address: | 81 Hickory Hollow Drive |
| Crossville, TN 38555 | |
| Phone # for sales: | 904-303-4814 |
| Website: | trendzetterz.com |
| E-mail address: | support@trendzetterz.com |
Traders' Resource Links | |
| Trendzetterz has not added any product or service information to TRADERS' RESOURCE. | |
Click here for more information about our publications!
PRINT THIS ARTICLE

Request Information From Our Sponsors
- StockCharts.com, Inc.
- Candle Patterns
- Candlestick Charting Explained
- Intermarket Technical Analysis
- John Murphy on Chart Analysis
- John Murphy's Chart Pattern Recognition
- John Murphy's Market Message
- MurphyExplainsMarketAnalysis-Intermarket Analysis
- MurphyExplainsMarketAnalysis-Visual Analysis
- StockCharts.com
- Technical Analysis of the Financial Markets
- The Visual Investor
- VectorVest, Inc.
- Executive Premier Workshop
- One-Day Options Course
- OptionsPro
- Retirement Income Workshop
- Sure-Fire Trading Systems (VectorVest, Inc.)
- Trading as a Business Workshop
- VectorVest 7 EOD
- VectorVest 7 RealTime/IntraDay
- VectorVest AutoTester
- VectorVest Educational Services
- VectorVest OnLine
- VectorVest Options Analyzer
- VectorVest ProGraphics v6.0
- VectorVest ProTrader 7
- VectorVest RealTime Derby Tool
- VectorVest Simulator
- VectorVest Variator
- VectorVest Watchdog
