HOT TOPICS LIST
- MACD
- Fibonacci
- RSI
- Gann
- ADXR
- Stochastics
- Volume
- Triangles
- Futures
- Cycles
- Volatility
- ZIGZAG
- MESA
- Retracement
- Aroon
INDICATORS LIST
LIST OF TOPICS
PRINT THIS ARTICLE
by Koos van der Merwe
Helen Of Troy Ltd. reports record net sales revenue.
Position: Buy
Koos van der Merwe
Has been a technical analyst since 1969, and has worked as a futures and options trader with First Financial Futures in Johannesburg, South Africa.
PRINT THIS ARTICLE
RSI
Helen Of Troy Ltd. Net Sale Revenue
11/27/12 12:52:58 PMby Koos van der Merwe
Helen Of Troy Ltd. reports record net sales revenue.
Position: Buy
| There is no doubt in my mind that the US stock market is moving into a bull market over the next few months. History has shown that the months of November to February are always good, and with strong sales figures for Black Friday, we can expect strong sales figures for holiday shopping. This may be the reason why my charts identified the Helen of Troy retailer as a share to own. |

|
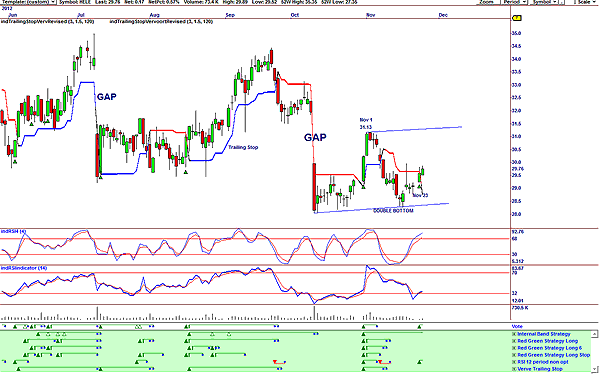
| FIGURE 1: HELE, DAILY. This chart shows a vote line buy signal. |
| Graphic provided by: OmniTrader. |
| |
| Figure 1, a daily chart with my buy strategies, gave me a buy signal on the 12-period relative strength index (RSI) signal. The price at that time was $29.76. Previous buy signals given on the vote line have been good, and had we followed them, we would have made a good profit. The two gaps on the chart are troubling, however. Why did they occur? We would have to look at fundamentals to determine this, but in both cases, note how the price did rise to fill the gaps. With the double bottom that has formed, and with the RSI 14-period indicator giving a buy signal as shown on the indicator, the stock does look tempting. I would look at the high of $31.13, the high reached on November 1 as a possible target. The RSI four-period indicator is overbought, suggesting that conservative investors could wait before buying. |

|
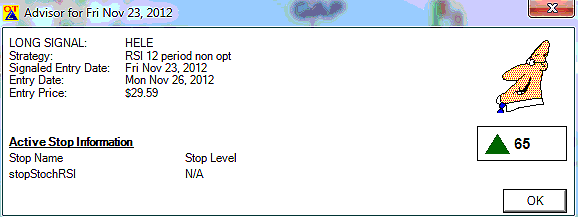
| FIGURE 2: ADVISOR RATING |
| Graphic provided by: OmniTrader. |
| |
| The advisor rating shown in Figure 2 is 65, a very strong rating, suggesting that the share is a buy at present levels. The active stop, shown in the rating, is the stochastic RSI. At the moment, a stop level is not given. I would be a buyer of the Helen of Troy retailer at present levels, but I would be prepared to only hold it for the short term, relying on strong sales over the holiday period to strengthen the price. |
Has been a technical analyst since 1969, and has worked as a futures and options trader with First Financial Futures in Johannesburg, South Africa.
| Address: | 3256 West 24th Ave |
| Vancouver, BC | |
| Phone # for sales: | 6042634214 |
| E-mail address: | petroosp@gmail.com |
Click here for more information about our publications!
Comments

Request Information From Our Sponsors
- StockCharts.com, Inc.
- Candle Patterns
- Candlestick Charting Explained
- Intermarket Technical Analysis
- John Murphy on Chart Analysis
- John Murphy's Chart Pattern Recognition
- John Murphy's Market Message
- MurphyExplainsMarketAnalysis-Intermarket Analysis
- MurphyExplainsMarketAnalysis-Visual Analysis
- StockCharts.com
- Technical Analysis of the Financial Markets
- The Visual Investor
- VectorVest, Inc.
- Executive Premier Workshop
- One-Day Options Course
- OptionsPro
- Retirement Income Workshop
- Sure-Fire Trading Systems (VectorVest, Inc.)
- Trading as a Business Workshop
- VectorVest 7 EOD
- VectorVest 7 RealTime/IntraDay
- VectorVest AutoTester
- VectorVest Educational Services
- VectorVest OnLine
- VectorVest Options Analyzer
- VectorVest ProGraphics v6.0
- VectorVest ProTrader 7
- VectorVest RealTime Derby Tool
- VectorVest Simulator
- VectorVest Variator
- VectorVest Watchdog
