HOT TOPICS LIST
- MACD
- Fibonacci
- RSI
- Gann
- ADXR
- Stochastics
- Volume
- Triangles
- Futures
- Cycles
- Volatility
- ZIGZAG
- MESA
- Retracement
- Aroon
INDICATORS LIST
LIST OF TOPICS
PRINT THIS ARTICLE
by Koos van der Merwe
With the reelection of President Barack Obama and the idea that Obamacare is here to stay, looking at health-care stocks is a must.
Position: Buy
Koos van der Merwe
Has been a technical analyst since 1969, and has worked as a futures and options trader with First Financial Futures in Johannesburg, South Africa.
PRINT THIS ARTICLE
RSI
Cross Country Healthcare
11/28/12 08:13:57 AMby Koos van der Merwe
With the reelection of President Barack Obama and the idea that Obamacare is here to stay, looking at health-care stocks is a must.
Position: Buy
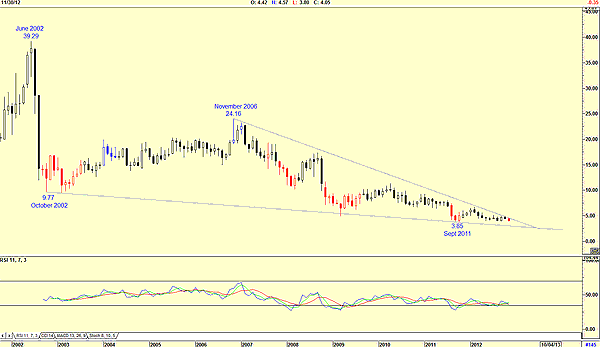
| Cross Country Healthcare is a stock that has fallen badly over the months. From a high of $39.29 in June 2002, it has steadily fallen, reaching a low of $3.85 by September 2011. |

|
| FIGURE 1: CCRN, MONTHLY |
| Graphic provided by: AdvancedGET. |
| |
| Figure 1 is a monthly chart showing how the price fell dramatically from June 2002 to $9.77 by October 2002. The price then rose to $24.16 by November 2006 and then over the following five years fell to $3.85 by September 2011. Since then the price has moved sideways, trading at $4.05, its present price. |

|
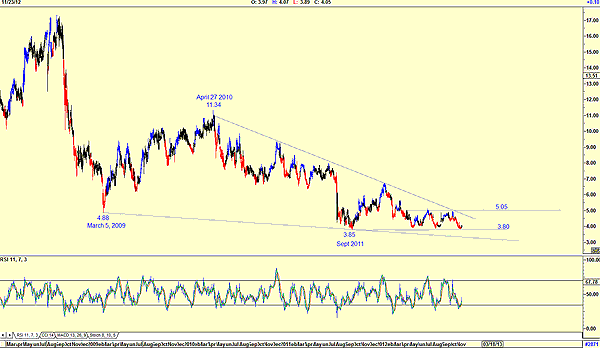
| FIGURE 2: CCRN, DAILY |
| Graphic provided by: AdvancedGET. |
| |
| The daily chart in Figure 2 shows price dropping to a low of $3.85 by September 2011. What is interesting is the strong support at the $3.82 to $3.85 price range. With the relative strength index (RSI) suggesting a buy and the resistance at $5.05, a possible buy is likely in the cards. |

|
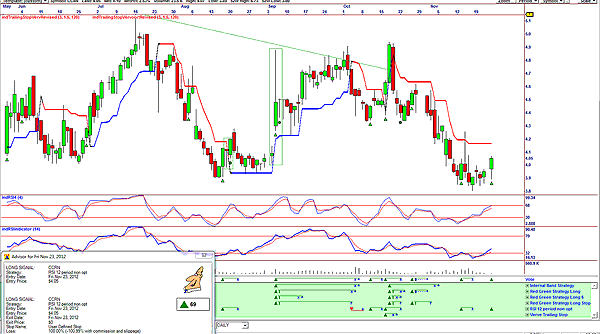
| FIGURE 3: CCRN, DAILY, OMNITRADER |
| Graphic provided by: Nirvana Systems. |
| |
| My final chart, in Figure 3, is a chart with the vote line suggesting a buy signal at the advisor rating of 69. This is a strong signal, based on the RSI 12-period strategy shown in green below the vote line. The two indicators on the chart, the RSI four-period indicator and the RSI 14-period indicator, are in a bullish trend. I would be a buyer of Cross Country Healthcare at the present price, but consider selling as the price approaches the resistance line at $5.05. |
Has been a technical analyst since 1969, and has worked as a futures and options trader with First Financial Futures in Johannesburg, South Africa.
| Address: | 3256 West 24th Ave |
| Vancouver, BC | |
| Phone # for sales: | 6042634214 |
| E-mail address: | petroosp@gmail.com |
Click here for more information about our publications!
PRINT THIS ARTICLE

|

Request Information From Our Sponsors
- StockCharts.com, Inc.
- Candle Patterns
- Candlestick Charting Explained
- Intermarket Technical Analysis
- John Murphy on Chart Analysis
- John Murphy's Chart Pattern Recognition
- John Murphy's Market Message
- MurphyExplainsMarketAnalysis-Intermarket Analysis
- MurphyExplainsMarketAnalysis-Visual Analysis
- StockCharts.com
- Technical Analysis of the Financial Markets
- The Visual Investor
- VectorVest, Inc.
- Executive Premier Workshop
- One-Day Options Course
- OptionsPro
- Retirement Income Workshop
- Sure-Fire Trading Systems (VectorVest, Inc.)
- Trading as a Business Workshop
- VectorVest 7 EOD
- VectorVest 7 RealTime/IntraDay
- VectorVest AutoTester
- VectorVest Educational Services
- VectorVest OnLine
- VectorVest Options Analyzer
- VectorVest ProGraphics v6.0
- VectorVest ProTrader 7
- VectorVest RealTime Derby Tool
- VectorVest Simulator
- VectorVest Variator
- VectorVest Watchdog
