HOT TOPICS LIST
- MACD
- Fibonacci
- RSI
- Gann
- ADXR
- Stochastics
- Volume
- Triangles
- Futures
- Cycles
- Volatility
- ZIGZAG
- MESA
- Retracement
- Aroon
INDICATORS LIST
LIST OF TOPICS
PRINT THIS ARTICLE
by Donald W. Pendergast, Jr.
Up by more than 45% over the past six months, shares of Bank of America may be setting up for yet another surge higher into December 2012.
Position: N/A
Donald W. Pendergast, Jr.
Freelance financial markets writer and online publisher of the Trendzetterz.com S&P 500 Weekly Forecast service.
PRINT THIS ARTICLE
CYCLES
Bank Of America Bullish Continuation Possible?
11/27/12 11:29:16 AMby Donald W. Pendergast, Jr.
Up by more than 45% over the past six months, shares of Bank of America may be setting up for yet another surge higher into December 2012.
Position: N/A
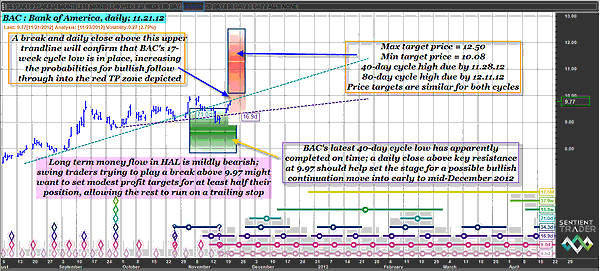
| Bank of America (BAC) put in a significant multicycle low back on May 21, 2012, when six separate cycles ranging from five days to nearly 17 weeks in length all bottomed simultaneously. The stock of the largest US bank has had a somewhat volatile run higher over the six months, but for long-term position traders, the open gains have well been worth the wait. BAC may now be ready to burst higher from a nearly 10-week-old trading range/consolidation pattern, with several technical tools confirming that the path of least resistance in the stock is likely toward higher valuations. Here's a closer look now. See Figure 1. |

|
| FIGURE 1: BAC, DAILY. A break above 9.78 may be the trigger that launches BAC into its red 40-day time/price target zone. Long-term money flow is still slightly negative; swing traders may want to set modest profit trades, should a continuation move commence soon. |
| Graphic provided by: Sentient Trader. |
| |
| BAC can trend powerfully at times, but since mid-September 2012 the stock has been confined to a range between 8.70 and 9.97, never really seeming to get any sufficient momentum going, bullish or bearish. However, this bout of indecision may soon be rectified, especially if the stock can make a daily close above the 71-day valid trendline (VTL); a close above this key cycles-derived resistance level will confirm that the 16.8-day cycle low is in place and will be a major boost of confidence for those attempting to time a long entry in BAC. Just above the VTL level is actual chart resistance at 9.97 (the most recent swing high), and a daily close above this level is also going to draw more buyers into BAC. Of course, that BAC has just fired a new long RMO swing buy signal is yet another vote of confidence by the bulls; a rise above 9.78 triggers a new buy signal. See Figure 2. |

|
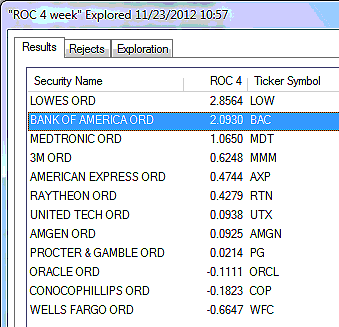
| FIGURE 2: OEX. BAC is among a handful of .OEX stocks issuing RMO buy signals on November 21, 2012; the stock is easily outperforming the Standard & Poor's 500 over the last four-week period. |
| Graphic provided by: MetaStock. |
| Graphic provided by: MetaStock Explorer. |
| |
| BAC's long-term money flow is still a bit below its zero line, meaning that traders going long at any of the potential buy levels already mentioned should set conservative price tagets for at least half their position. The stock has excellent four-week relative strength versus the .SPX, however, so that also weighs favorably on the bullish side of the equation. The green zone on the chart informs us that BAC has in all likelihood completed its 40-day cycle low and that it has an above-average chance of rising somewhere between 10.08 and 12.50 between now and December 11, 2012. BAC's 40- and 80-day cycles have virtually the same anticipated price range (vertical aspect of red zone), with the 80-day cycle expected to peak 13 calendar days later than the 40-day cycle. |
| Playing BAC on the long side here is straightforward. If filled on a break above 9.78, begin trailing the position with BAC's nine-day exponential moving average (EMA) (currently near 9.45) and if you see the stock reach its minimum red zone price target of 10.08, take profits on at least a third if not half of your position, letting the nine-day EMA be your guide when to close the tradeout -- a daily close below that average might be a pretty good indication that a rally attempt has fizzled out. Risking no more than 2% of your account value on this or any other stock trade can help ensure you won't get wiped out by a string of losses as it can help you maximize your gains, assuming you already have a successful trading system. |
Freelance financial markets writer and online publisher of the Trendzetterz.com S&P 500 Weekly Forecast service.
| Title: | Market consultant and writer |
| Company: | Trendzetterz |
| Address: | 81 Hickory Hollow Drive |
| Crossville, TN 38555 | |
| Phone # for sales: | 904-303-4814 |
| Website: | trendzetterz.com |
| E-mail address: | support@trendzetterz.com |
Traders' Resource Links | |
| Trendzetterz has not added any product or service information to TRADERS' RESOURCE. | |
Click here for more information about our publications!
PRINT THIS ARTICLE

Request Information From Our Sponsors
- VectorVest, Inc.
- Executive Premier Workshop
- One-Day Options Course
- OptionsPro
- Retirement Income Workshop
- Sure-Fire Trading Systems (VectorVest, Inc.)
- Trading as a Business Workshop
- VectorVest 7 EOD
- VectorVest 7 RealTime/IntraDay
- VectorVest AutoTester
- VectorVest Educational Services
- VectorVest OnLine
- VectorVest Options Analyzer
- VectorVest ProGraphics v6.0
- VectorVest ProTrader 7
- VectorVest RealTime Derby Tool
- VectorVest Simulator
- VectorVest Variator
- VectorVest Watchdog
- StockCharts.com, Inc.
- Candle Patterns
- Candlestick Charting Explained
- Intermarket Technical Analysis
- John Murphy on Chart Analysis
- John Murphy's Chart Pattern Recognition
- John Murphy's Market Message
- MurphyExplainsMarketAnalysis-Intermarket Analysis
- MurphyExplainsMarketAnalysis-Visual Analysis
- StockCharts.com
- Technical Analysis of the Financial Markets
- The Visual Investor
