HOT TOPICS LIST
- MACD
- Fibonacci
- RSI
- Gann
- ADXR
- Stochastics
- Volume
- Triangles
- Futures
- Cycles
- Volatility
- ZIGZAG
- MESA
- Retracement
- Aroon
INDICATORS LIST
LIST OF TOPICS
PRINT THIS ARTICLE
by Koos van der Merwe
Many of those interested in the markets have read the classic "Elliott Wave Principle" by AJ Frost and Robert Prechter. What do the authors say about what market participants should do?
Position: Buy
Koos van der Merwe
Has been a technical analyst since 1969, and has worked as a futures and options trader with First Financial Futures in Johannesburg, South Africa.
PRINT THIS ARTICLE
ELLIOTT WAVE
Elliott Wave Variations
11/27/12 11:42:16 AMby Koos van der Merwe
Many of those interested in the markets have read the classic "Elliott Wave Principle" by AJ Frost and Robert Prechter. What do the authors say about what market participants should do?
Position: Buy
| In chapter 1 of the book, a paragraph states that in "a bull market, the basic objective of Elliott's rules is to follow and count correctly the development of a five-wave advance in the averages, three up, with two intervening down." We all know that wave 2 can be as much as a 72% retracement of wave 1 and that wave 3 must be larger than wave 1. Wave 5 should not be less than wave 1. This is the standard rule: "The chart must look correct" is rule 1. However, many years ago, when I noticed that wave 3 was less than wave 1, I wrote to Robert Prechter, and asked him if this could be correct. "Yes," he replied, "but then wave 5 must be less than wave 3. The correction that follows will be mild." This rule does not appear in his book, but it is a rule that should be kept in mind. |

|
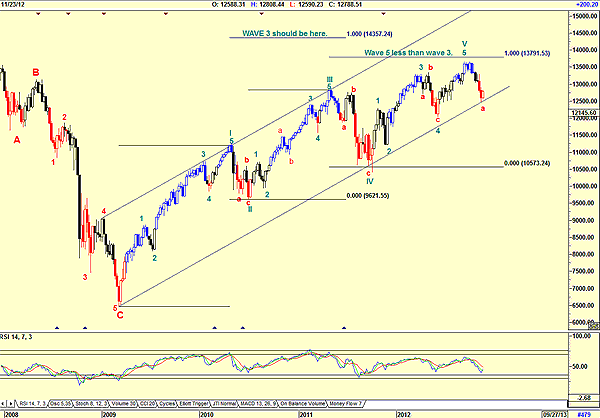
| FIGURE 1: DJIA, WEEKLY. Here's the Dow Jones showing an Elliott wave count. |
| Graphic provided by: AdvancedGET. |
| |
| I mention this, because in Figure 1, a weekly chart of the Dow Jones Industrial Average (DJIA) shows that wave 3 is smaller than wave 1, which means that wave 5 should be less than wave 3. This is exactly what has happened. On the chart I have shown where wave 3 should have topped. I have also shown that wave 5 is less than wave 3. This means that the ABC correction should be mild. At the moment, wave a has found support on the trendline. It should correct upward in a b wave and then fall, probably to below the trendline. This will be supported by the relative strength index (RSI), which is still in a bear trend. But didn't I write that the correction should be a mild one? In other words, there need not be a wave b and wave c correction. Confusing, isn't it? |

|
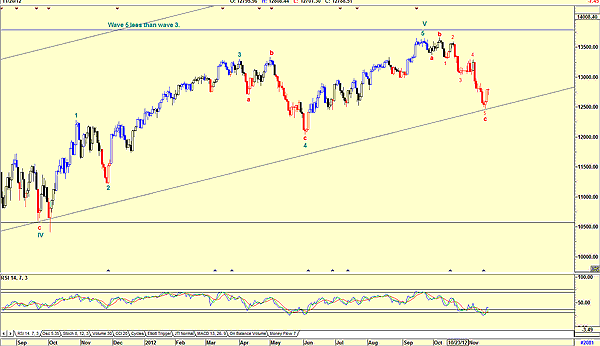
| FIGURE 2: DJIA, DAILY |
| Graphic provided by: AdvancedGET. |
| |
| The daily chart, in Figure 2, suggests that the correction is complete. The a,b,c correction, with wave c falling in the expected five waves, looks pretty solid, especially with the RSI in buy mode. This Elliott wave count does suggest that a new bull trend is starting. Both charts look interesting, with political uncertainty with the fiscal cliff in the United States, threat of war in the Middle East and Europe recovering slowly, not as fast as one would like. Ben Bernanke spoke in a speech on Tuesday, November 20, being extremely conservative. But Elliott wave theory is calling for a bull market. One must never forget, however, that Elliott wave is a signpost in the wilderness, and a signpost can change a little way down the road. In the meantime, do follow what the sign says. |
Has been a technical analyst since 1969, and has worked as a futures and options trader with First Financial Futures in Johannesburg, South Africa.
| Address: | 3256 West 24th Ave |
| Vancouver, BC | |
| Phone # for sales: | 6042634214 |
| E-mail address: | petroosp@gmail.com |
Click here for more information about our publications!
Comments
Date: 11/29/12Rank: 5Comment: The fact that the bull market was over 200 weeks and the correction is 9 weeks does not look right. Your analysis from late October was more correct. You have the rally to early 2011 as wave 1 of wave 3. I see the most recent rally from September 2011 as the a next order down wave 1. Holding the most recent wave 4 at 12,000 needs to hold.

Request Information From Our Sponsors
- VectorVest, Inc.
- Executive Premier Workshop
- One-Day Options Course
- OptionsPro
- Retirement Income Workshop
- Sure-Fire Trading Systems (VectorVest, Inc.)
- Trading as a Business Workshop
- VectorVest 7 EOD
- VectorVest 7 RealTime/IntraDay
- VectorVest AutoTester
- VectorVest Educational Services
- VectorVest OnLine
- VectorVest Options Analyzer
- VectorVest ProGraphics v6.0
- VectorVest ProTrader 7
- VectorVest RealTime Derby Tool
- VectorVest Simulator
- VectorVest Variator
- VectorVest Watchdog
- StockCharts.com, Inc.
- Candle Patterns
- Candlestick Charting Explained
- Intermarket Technical Analysis
- John Murphy on Chart Analysis
- John Murphy's Chart Pattern Recognition
- John Murphy's Market Message
- MurphyExplainsMarketAnalysis-Intermarket Analysis
- MurphyExplainsMarketAnalysis-Visual Analysis
- StockCharts.com
- Technical Analysis of the Financial Markets
- The Visual Investor
