HOT TOPICS LIST
- MACD
- Fibonacci
- RSI
- Gann
- ADXR
- Stochastics
- Volume
- Triangles
- Futures
- Cycles
- Volatility
- ZIGZAG
- MESA
- Retracement
- Aroon
INDICATORS LIST
LIST OF TOPICS
PRINT THIS ARTICLE
by Gary Grosschadl
When looking for reversal patterns, double bottom formations can provide the basis for excellent short-term gains.
Position: N/A
Gary Grosschadl
Independent Canadian equities trader and technical analyst based in Peterborough
Ontario, Canada.
PRINT THIS ARTICLE
DOUBLE BOTTOMS
JDS Uniphase Makes Fast Gains Off Its Double Bottom
07/19/02 01:39:40 PMby Gary Grosschadl
When looking for reversal patterns, double bottom formations can provide the basis for excellent short-term gains.
Position: N/A
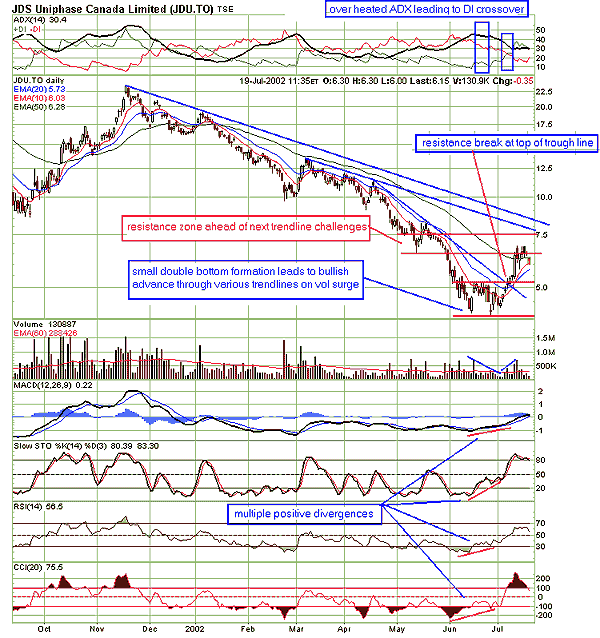
| Despite all the market turbulance, this high tech player has made an impressive move off a recognizable pattern -- the double bottom. Those that are familiar with my trading style will not be surprised to see my recurring theme of adding "the power of multiple divergences" to identifying good trading opportunities. I find many patterns that work in all time frames. Although the double bottom is generally thought of in longer time frames lasting from several weeks to several months it can also work in shorter time spans, albeit with elevated risk. |
| Volume pattern at JDS's double bottom is correct if not classic. The second bottomming area has less volume as the power of the bears has diminished. After the first trough, the decline from the peak has diminished volume. More importantly you can see a bullish advance with growing volume off the second trough/bottom. Small gaps here are a welcome sign pointing to good buying pressure. A good price target would be measured as the distance from the trough bottom to the resistance area marking the peak of the trough. This target has already been met and exceeded as the stock surged to its 50-day EMA overhead resistance line. |

|
| Graphic provided by: stockcharts.com. |
| |
| The dispayed indicators show multiple positive divergences off this likely double bottom formation in its early stages, giving the aggressive short-term trader some confidence in trading this pattern. |
| There were two other important clues pointing to likely success here. The directional movement indicator (ADX) was showing one of my favorite patterns -- "overheated ADX pushing for DI reversal." This often leads to a bullish reversal for the DI's, showing buyers (bulls) had seized control from the sellers (bears). Secondly, there has been an important move above the 20-day EMA, a daunting resistance level in this viscious bear phase. The successful move above this line and the ensuing 10/20 EMA crossover shows early promise of a trend change. |
| So where does JDU go from here? JDU is likely to take a breather as some prudent profit taking occurs in these turbulent days. A good sign going ahead would be to see support from its 20-day EMA currently at 5.70. This would be a bullish base before the stock attempts to challenge the next trendline resistances shown on the chart. Note that the $7.50 area looks to be a key congestion/resistance area going forward from here, and it could take several attempts to beat this level. On the downside, traders should be wary of a move below the 20-day EMA support as this will likely signal the continuation of the previous bearish trend and could label the last advance as just another bear rally. |
Independent Canadian equities trader and technical analyst based in Peterborough
Ontario, Canada.
| Website: | www.whatsonsale.ca/financial.html |
| E-mail address: | gwg7@sympatico.ca |
Click here for more information about our publications!
Comments
Date: 07/21/02Rank: 5Comment: what do you think of IVX s pattern? is there a double bottom? many thanks, scott
Date: 07/27/02Rank: 5Comment:

Request Information From Our Sponsors
- StockCharts.com, Inc.
- Candle Patterns
- Candlestick Charting Explained
- Intermarket Technical Analysis
- John Murphy on Chart Analysis
- John Murphy's Chart Pattern Recognition
- John Murphy's Market Message
- MurphyExplainsMarketAnalysis-Intermarket Analysis
- MurphyExplainsMarketAnalysis-Visual Analysis
- StockCharts.com
- Technical Analysis of the Financial Markets
- The Visual Investor
- VectorVest, Inc.
- Executive Premier Workshop
- One-Day Options Course
- OptionsPro
- Retirement Income Workshop
- Sure-Fire Trading Systems (VectorVest, Inc.)
- Trading as a Business Workshop
- VectorVest 7 EOD
- VectorVest 7 RealTime/IntraDay
- VectorVest AutoTester
- VectorVest Educational Services
- VectorVest OnLine
- VectorVest Options Analyzer
- VectorVest ProGraphics v6.0
- VectorVest ProTrader 7
- VectorVest RealTime Derby Tool
- VectorVest Simulator
- VectorVest Variator
- VectorVest Watchdog
