HOT TOPICS LIST
- MACD
- Fibonacci
- RSI
- Gann
- ADXR
- Stochastics
- Volume
- Triangles
- Futures
- Cycles
- Volatility
- ZIGZAG
- MESA
- Retracement
- Aroon
INDICATORS LIST
LIST OF TOPICS
PRINT THIS ARTICLE
by Donald W. Pendergast, Jr.
Down by nearly 31% since early May 2012, shares of Intel Corp. may be getting ripe for a bullish trend reversal.
Position: N/A
Donald W. Pendergast, Jr.
Freelance financial markets writer and online publisher of the Trendzetterz.com S&P 500 Weekly Forecast service.
PRINT THIS ARTICLE
CYCLES
Intel Overdue For A Rally?
11/26/12 09:46:09 AMby Donald W. Pendergast, Jr.
Down by nearly 31% since early May 2012, shares of Intel Corp. may be getting ripe for a bullish trend reversal.
Position: N/A
| Just like the PC/notebook manufacturers that it has supplied microprocessors to for the past three decades, the stock price of Intel Corp. (INTC) has also been under heavy bearish pressure over the last six months, causing many to wonder if the nearly three-decade-old WinTel consortium has finally been dethroned as the reigning rulers of the kingdom of tech. As bad as INTC's daily chart looks right now (Figure 1), even the worst of downtrends eventually end (especially if a company goes out of business, but that isn't likely to happen to INTC for a long time), and in INTC's case, a powerful case can be made for a significant rally in its share prices. Here's a closer look now. |

|
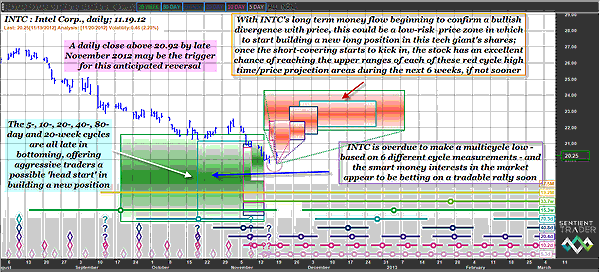
| FIGURE 1: INTC, DAILY. With so many price cycles being late to bottom at a time when long term money flow shows signs of bullish divergence with price -- and with Intel trading just above a strong support level -- the eruption of a major short-covering rally becomes more likely between now and early December 2012. |
| Graphic provided by: Sentient Trader. |
| |
| Intel's downward momentum in the wake of its May 3, 2012, swing high of 29.27 has remained fairly constant, with there being little doubt that it's the higher-degree cycles that are hard at work drawing the stock down to ever lower valuations. Currently trading near 19.51 as this is written, the stock is only about $0.35 above its last multicycle swing low of 19.16 (made in August-September 2011), meaning that the stock is fast approaching a key make-or-break area of support. As grim as the chart looks, cyclical studies reveal that no less than six price cycles -- ranging from five days to 20 weeks in length -- are all overdue to make another major low (the green shaded areas depict this). This doesn't mean the stock can't or won't go any lower, but the probabilities strongly suggest that a major low will be achieved sooner rather than later, especially since INTC's long-term (daily chart basis) money flow is near a historically low reading and is also showing signs of bullish divergence with price. Taken as a whole, all three of these key technical dynamics (strong support/multiple overdue cycle lows/bullish money flow divergence) help paint a convincing image of a key large-cap stock that is ripe for a bullish trend reversal as 2012 draws to a close. |

|
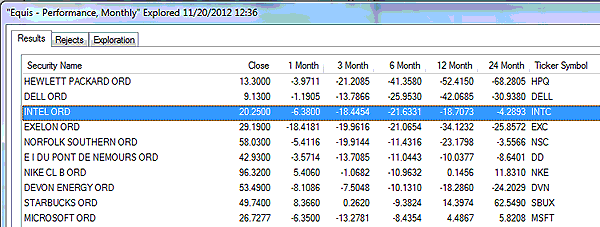
| FIGURE 2: RANKINGS. Observe the monthly performance rankings of 10 major OEX stocks over the past two years. Note that the three worst performers over the past six months are all heavily dependent on the health of the PC and notebook markets. |
| Graphic provided by: MetaStock. |
| Graphic provided by: MetaStock Explorer. |
| |
| The red zones depict the statistically derived time/price targets for each of the six cycles analyzed. Since no one knows exactly when INTC will make its ultimate low, one way to play the stock for a minor bounce is to wait for it to make a daily close above 20.92 and then sell a January '13 INTC $19.00 put (or puts). (See figure 2.) These puts have a close bid-ask spread and the strike price can give a trader a bit of a cushion, just in case a break higher proves to be a fake. The big idea is, of course, to hold the put long enough to buy it back for 50% or 60% less than you sold it for, walking away with a nice profit if the trend reversal gathers quickly gathers steam. The strong support level at 19.16 also provides an extra buffer of protection for the position, but in no case should you allow the option to double in price before buying it back for a loss. As always, never risk more than 2% of your account equity on this or any other trade and don't get married to any position, now matter how strongly you may feel about a stock's bullish (or bearish) potential. Trade wisely until we meet here again. |
Freelance financial markets writer and online publisher of the Trendzetterz.com S&P 500 Weekly Forecast service.
| Title: | Market consultant and writer |
| Company: | Trendzetterz |
| Address: | 81 Hickory Hollow Drive |
| Crossville, TN 38555 | |
| Phone # for sales: | 904-303-4814 |
| Website: | trendzetterz.com |
| E-mail address: | support@trendzetterz.com |
Traders' Resource Links | |
| Trendzetterz has not added any product or service information to TRADERS' RESOURCE. | |
Click here for more information about our publications!
PRINT THIS ARTICLE

Request Information From Our Sponsors
- VectorVest, Inc.
- Executive Premier Workshop
- One-Day Options Course
- OptionsPro
- Retirement Income Workshop
- Sure-Fire Trading Systems (VectorVest, Inc.)
- Trading as a Business Workshop
- VectorVest 7 EOD
- VectorVest 7 RealTime/IntraDay
- VectorVest AutoTester
- VectorVest Educational Services
- VectorVest OnLine
- VectorVest Options Analyzer
- VectorVest ProGraphics v6.0
- VectorVest ProTrader 7
- VectorVest RealTime Derby Tool
- VectorVest Simulator
- VectorVest Variator
- VectorVest Watchdog
- StockCharts.com, Inc.
- Candle Patterns
- Candlestick Charting Explained
- Intermarket Technical Analysis
- John Murphy on Chart Analysis
- John Murphy's Chart Pattern Recognition
- John Murphy's Market Message
- MurphyExplainsMarketAnalysis-Intermarket Analysis
- MurphyExplainsMarketAnalysis-Visual Analysis
- StockCharts.com
- Technical Analysis of the Financial Markets
- The Visual Investor
