HOT TOPICS LIST
- MACD
- Fibonacci
- RSI
- Gann
- ADXR
- Stochastics
- Volume
- Triangles
- Futures
- Cycles
- Volatility
- ZIGZAG
- MESA
- Retracement
- Aroon
INDICATORS LIST
LIST OF TOPICS
PRINT THIS ARTICLE
by Koos van der Merwe
In today's uncertain and volatile market, looking for future investments is always a plus. Holly Frontier may be worth a look.
Position: Sell
Koos van der Merwe
Has been a technical analyst since 1969, and has worked as a futures and options trader with First Financial Futures in Johannesburg, South Africa.
PRINT THIS ARTICLE
ELLIOTT WAVE
Holly Frontier A Possible Investment?
11/20/12 10:32:27 AMby Koos van der Merwe
In today's uncertain and volatile market, looking for future investments is always a plus. Holly Frontier may be worth a look.
Position: Sell
| Holly Frontier (HFC) is an independent energy company engaged in the refining of crude oil and the marketing of refined petroleum products. What brought the company to my attention was the buy signal given in Figure 1. |

|
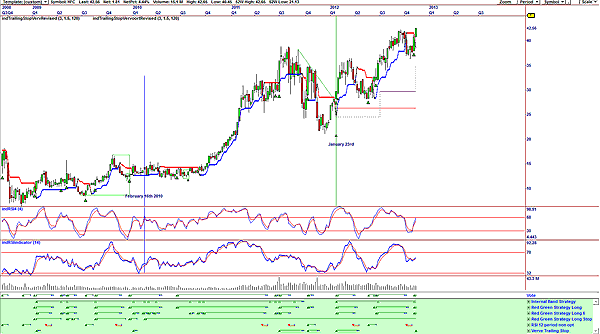
| FIGURE 1: HFC, WEEKLY. This chart shows a vote line buy signal. |
| Graphic provided by: OmniTrader. |
| |
| Figure 1 is a weekly chart and shows the buy signal in the vote line, a result of buy signals given by the red-green strategy long, the red-green strategy long 6, and the Verve trailing stop. The internal band strategy gave a buy signal on January 23. Do note that the red-green strategy long stop has been in continuous buy mode since February 16, 2010, when the price was $13.70. Note that the relative strength index (RSI) four-period indicator is bullish, but the 14-period RSI is bearish. To understand the stock's movement, I looked at the daily chart. |

|
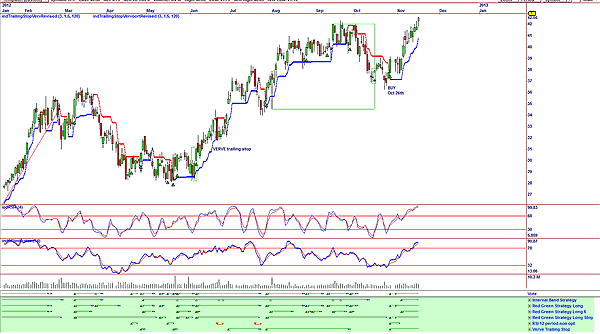
| FIGURE 2: HFC, DAILY. This chart shows vote line buy signals. |
| Graphic provided by: OmniTrader. |
| |
| Figure 2 shows a buy signal given by the vote line on October 26, as the price crossed above the Verve trailing stop. Both the RSI four-period and the RSI 14-period are in sync, at overbought levels. This suggests that we should not buy the stock at present prices but should watch for a sell signal that could be triggered. The recent rise in the price was on falling volume, a sign of weakness. |

|
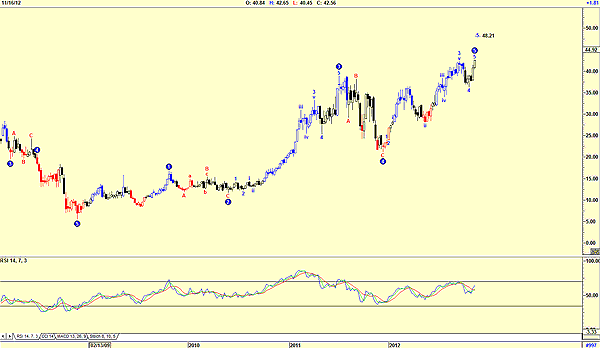
| FIGURE 3: HFC, WEEKLY. This chart shows an Elliott wave count. |
| Graphic provided by: AdvancedGET. |
| |
| I would not be a buyer of the stock at present levels but would watch for the Elliott wave ABC correction (Figure 3) and start accumulating as the C-wave finalizes and the 14-period RSI is in the buy zone. |
Has been a technical analyst since 1969, and has worked as a futures and options trader with First Financial Futures in Johannesburg, South Africa.
| Address: | 3256 West 24th Ave |
| Vancouver, BC | |
| Phone # for sales: | 6042634214 |
| E-mail address: | petroosp@gmail.com |
Click here for more information about our publications!
PRINT THIS ARTICLE

Request Information From Our Sponsors
- StockCharts.com, Inc.
- Candle Patterns
- Candlestick Charting Explained
- Intermarket Technical Analysis
- John Murphy on Chart Analysis
- John Murphy's Chart Pattern Recognition
- John Murphy's Market Message
- MurphyExplainsMarketAnalysis-Intermarket Analysis
- MurphyExplainsMarketAnalysis-Visual Analysis
- StockCharts.com
- Technical Analysis of the Financial Markets
- The Visual Investor
- VectorVest, Inc.
- Executive Premier Workshop
- One-Day Options Course
- OptionsPro
- Retirement Income Workshop
- Sure-Fire Trading Systems (VectorVest, Inc.)
- Trading as a Business Workshop
- VectorVest 7 EOD
- VectorVest 7 RealTime/IntraDay
- VectorVest AutoTester
- VectorVest Educational Services
- VectorVest OnLine
- VectorVest Options Analyzer
- VectorVest ProGraphics v6.0
- VectorVest ProTrader 7
- VectorVest RealTime Derby Tool
- VectorVest Simulator
- VectorVest Variator
- VectorVest Watchdog
